
Articles
- Page Path
- HOME > Epidemiol Health > Volume 45; 2023 > Article
-
Original Article
The association between obesity and glaucoma in older adults: evidence from the China Health and Retirement Longitudinal Study -
Xiaohuan Zhao1,2,3*
 , Qiyu Bo1,2,3*, Junran Sun1,2,3, Jieqiong Chen1,2,3, Tong Li1,2,3, Xiaoxu Huang1,2,3, Minwen Zhou1,2,3, Jing Wang1,2,3, Wenjia Liu1,2,3, Xiaodong Sun1,2,3
 -
Epidemiol Health 2023;45:e2023034.
DOI: https://doi.org/10.4178/epih.e2023034
Published online: March 9, 2023
1Department of Ophthalmology, Shanghai General Hospital (Shanghai First People’s Hospital), Shanghai Jiao Tong University School of Medicine, Shanghai, China
2National Clinical Research Center for Eye Diseases, Shanghai, China
3Shanghai Key Laboratory of Fundus Diseases, Shanghai, China
- Correspondence: Wenjia Liu Department of Ophthalmology, Shanghai General Hospital (Shanghai First People’s Hospital), Shanghai Jiao Tong University School of Medicine, Shanghai 200080, China E-mail: echocroft@163.com
- Co-correspondence: Jing Wang Department of Ophthalmology, Shanghai General Hospital (Shanghai First People’s Hospital), Shanghai Jiao Tong University School of Medicine, Shanghai 200080, China E-mail: dr_wangjing@163.com
- *Zhao & Bo contributed equally to this work as joint first authors.
© 2023, Korean Society of Epidemiology
This is an open-access article distributed under the terms of the Creative Commons Attribution License (http://creativecommons.org/licenses/by/4.0/), which permits unrestricted use, distribution, and reproduction in any medium, provided the original work is properly cited.
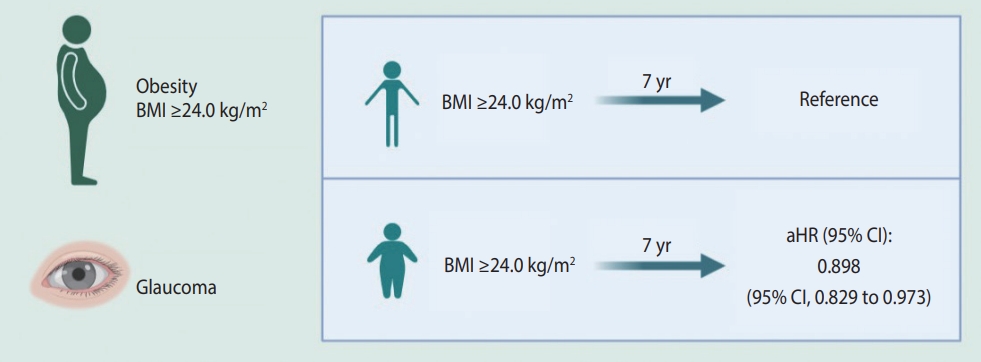
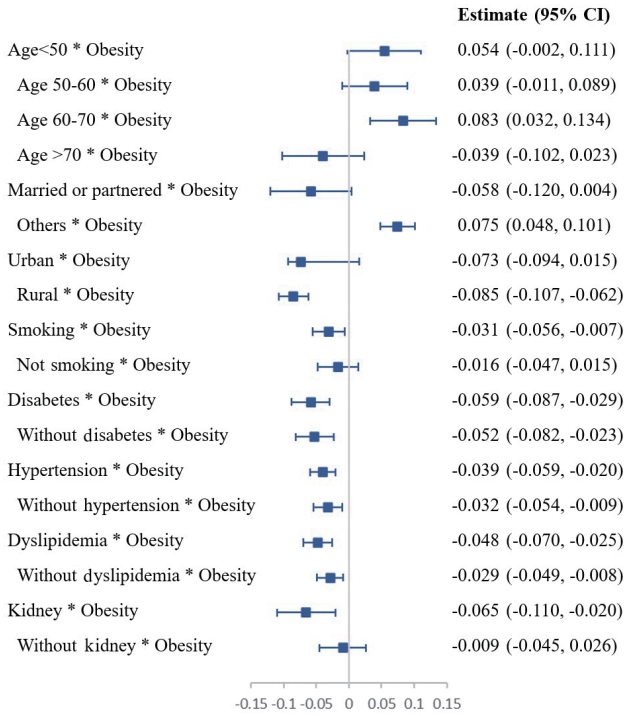
Figure & Data
References
Citations
- Evaluating the impact of caloric restriction, body mass index and exercise on primary open-angle glaucoma: A review
Jonathan YM Lai, Patrick Mclarnon, Carl Sheridan, Neeru A Vallabh
European Journal of Ophthalmology.2025; 35(2): 429. CrossRef - Obesity and its management in primary care setting
Mahmoud Ibrahim, Ebtesam M. Ba-Essa, Jessica A. Alvarez, Jason Baker, Vincenzo Bruni, Avivit Cahn, Antonio Ceriello, Francesco Cosentino, Melanie J. Davies, Francesco De Domenico, Robert H. Eckel, Allon N. Friedman, Jonathan Goldney, Omer Hamtzany, Scott
Journal of Diabetes and its Complications.2025; 39(7): 109045. CrossRef - The relationship between weight-adjusted-waist index, body mass index and diabetic retinopathy among American adults: a population-based analysis
Songtao Wang, Hecong Qin, Yu Zhang, Ning Yang, Jinsong Zhao
Scientific Reports.2024;[Epub] CrossRef - The Weight on Sight: Exploring the Links Between Obesity and Ocular Diseases
Ahmed Bilal, Muslim Bilal, Alia Hathaf, Danyal Usman, Nadim Haboubi
Cureus.2024;[Epub] CrossRef
 PubReader
 ePub Link
 Cite
Cite- Figure
-
- Related articles
-
- The association between glaucoma and all-cause mortality in middle-aged and elderly Chinese people: results from the China Health and Retirement Longitudinal Study
- Exploring cognitive trajectories and their association with physical performance: evidence from the China Health and Retirement Longitudinal Study
- Association of group-level segregation with cardiovascular health in older adults: an analysis of data from the Korean Social Life, Health, and Aging Project


Figure 1.
Figure 2.
| Characteristics | Total BMI quartiles, range (median), kg/m2 |
p-value | ||||
|---|---|---|---|---|---|---|
| Quartile 1, <20.8 (19.4) | Quartile 2, 20.8-23.1 (22.0) | Quartile 3, 23.1-25.7 (24.3) | Quartile 4, >25.7 (27.7) | |||
| No. of participants | 3,345 | 3,328 | 3,320 | 3,364 | ||
| Sex (female) | 45.0 | 48.9 | 56.1 | 62.7 | <0.001 | |
| Age (yr) | 62.1±10.4 | 59.0±9.8 | 58.1±9.4 | 57.1±8.9 | <0.001 | |
| Education | <0.001 | |||||
| Primary or below | 77.1 | 70.6 | 64.1 | 63.6 | ||
| Middle school | 15.7 | 19.8 | 22.8 | 23.4 | ||
| High school | 5.1 | 6.3 | 8.5 | 8.1 | ||
| College or above | 2.1 | 3.3 | 4.6 | 5.0 | ||
| Married or partnered | 82.3 | 86.0 | 88.5 | 91.1 | <0.001 | |
| Urban | 28.6 | 35.4 | 42.2 | 46.8 | <0.001 | |
| Smoking | 50.1 | 42.7 | 35.8 | 29.2 | <0.001 | |
| Drinking | <0.001 | |||||
| Drink more than once a month | 27.8 | 28.0 | 23.4 | 19.5 | ||
| Drink once a month or less | 7.4 | 8.2 | 8.5 | 7.4 | ||
| None | 64.8 | 63.8 | 68.1 | 73.1 | ||
| Diabetes | 8.9 | 11.2 | 14.2 | 19.8 | <0.001 | |
| Hypertension | 28.9 | 34.4 | 39.7 | 54.7 | <0.001 | |
| Dyslipidemia | 20.7 | 28.4 | 37.3 | 49.0 | <0.001 | |
| Kidney disease | 7.0 | 6.4 | 5.8 | 6.1 | 0.096 | |
| Variables | OR (95% CI) | p-value | |
|---|---|---|---|
| Sex (male) | 1.24 (1.10, 1.40) | <0.001 | |
| Age (yr) | <0.001 | ||
| <50 | 1.00 (reference) | ||
| 50-60 | 0.99 (0.87, 1.12) | 0.822 | |
| 60-70 | 1.31 (1.14, 1.50) | <0.001 | |
| >70 | 3.25 (2.79, 3.79) | <0.001 | |
| Obesity | 0.88 (0.80, 0.97) | 0.008 | |
| Education | 0.238 | ||
| Primary or below | 1.00 (reference) | ||
| Middle school | 1.01 (0.90, 1.13) | 0.875 | |
| High school | 0.88 (0.73, 1.06) | 0.185 | |
| College or above | 1.16 (0.94, 1.44) | 0.164 | |
| Married or partnered | 0.65 (0.58, 0.74) | <0.001 | |
| Urban | 1.60 (1.46, 1.75) | <0.001 | |
| Smoking | 1.16 (1.03, 1.30) | 0.011 | |
| Drinking | 0.020 | ||
| Drink more than once a month | 1.00 (reference) | ||
| Drink once a month or less | 0.98 (0.82, 1.17) | 0.814 | |
| None | 1.15 (1.03, 1.23) | 0.014 | |
| Diabetes | 1.38 (1.23, 1.56) | <0.001 | |
| Hypertension | 1.25 (1.14, 1.37) | <0.001 | |
| Dyslipidemia | 0.79 (0.72, 0.87) | <0.001 | |
| Kidney | 1.20 (1.01, 1.41) | 0.036 | |
| Constant | 0.19 | <0.001 | |
| Variables | Model 1 | p-value | Model 2 | p-value | |
|---|---|---|---|---|---|
| Sex (male) | 1.18 (1.09, 1.27) | <0.001 | 1.18 (1.07, 1.31) | 0.001 | |
| Age (yr) | |||||
| <50 | 1.00 (reference) | 1.00 (reference) | |||
| 50-60 | 1.02 (0.91, 1.15) | 0.669 | 0.98 (0.88, 1.10) | 0.783 | |
| 60-70 | 1.38 (1.23, 1.55) | <0.001 | 1.24 (1.09, 1.40) | 0.001 | |
| >70 | 3.05 (2.72, 3.42) | <0.001 | 2.43 (2.13, 2.76) | <0.001 | |
| Obesity | 0.95 (0.88, 1.02) | 0.190 | 0.90 (0.83, 0.97) | 0.009 | |
| Education | |||||
| Primary or below | - | 1.00 (reference) | |||
| Middle school | - | 1.01 (0.91, 1.11) | 0.890 | ||
| High school | - | 0.90 (0.76, 1.07) | 0.227 | ||
| College or above | - | 1.11 (0.93, 1.32) | 0.236 | ||
| Married or partnered | - | 0.73 (0.66, 0.80) | <0.001 | ||
| Urban | - | 1.45 (1.34, 1.56) | <0.001 | ||
| Smoking | - | 1.15 (1.04, 1.26) | 0.006 | ||
| Drinking | - | ||||
| Drink more than once a month | - | 1.00 (reference) | |||
| Drink once a month or less | - | 0.99 (0.85, 1.16) | 0.920 | ||
| None | - | 1.12 (1.02, 1.23) | 0.019 | ||
| Diabetes | - | 1.28 (1.16, 1.42) | <0.001 | ||
| Hypertension | - | 1.21 (1.12, 1.30) | <0.001 | ||
| Dyslipidemia | - | 0.83 (0.76, 0.90) | <0.001 | ||
| Kidney | - | 1.14 (0.99, 1.31) | 0.061 | ||
| Variables | Estimate (95% CI) | p-value | |
|---|---|---|---|
| Age <50 * Obesity | 0.054 (-0.002, 0.111) | 0.058 | |
| Age 50-60 * Obesity | 0.039 (-0.011, 0.089) | 0.123 | |
| Age 60-70 * Obesity | 0.083 (0.032, 0.134) | 0.001 | |
| Age >70 * Obesity | -0.039 (-0.102, 0.023) | 0.214 | |
| Married or partnered * Obesity | -0.058 (-0.120, 0.004) | 0.067 | |
| Others * Obesity | 0.075 (0.048, 0.101) | <0.001 | |
| Urban * Obesity | -0.073 (-0.094, 0.015) | 0.158 | |
| Rural * Obesity | -0.085 (-0.107, -0.062) | <0.001 | |
| Smoking * Obesity | -0.031 (-0.056, -0.007) | 0.012 | |
| Non-smoking * Obesity | -0.016 (-0.047, 0.015) | 0.312 | |
| Diabetes * Obesity | -0.059 (-0.087, -0.029) | <0.001 | |
| Without diabetes * Obesity | -0.052 (-0.082, -0.023) | <0.001 | |
| Hypertension * Obesity | -0.039 (-0.059, -0.020) | <0.001 | |
| Without hypertension * Obesity | -0.032 (-0.054, -0.009) | 0.005 | |
| Dyslipidemia * Obesity | -0.048 (-0.070, -0.025) | <0.001 | |
| Without dyslipidemia * Obesity | -0.029 (-0.049, -0.008) | 0.006 | |
| Kidney disease * Obesity | -0.065 (-0.110, -0.020) | 0.005 | |
| Without kidney disease * Obesity | -0.009 (-0.045, 0.026) | 0.605 | |
Values are presented as % or mean±standard deviation.
OR, odds ratio; CI, confidence interval.
Values are presented as hazard ratio (95% confidence interval).
CI, confidence interval.

