
Articles
- Page Path
- HOME > Epidemiol Health > Volume 46; 2024 > Article
-
Original Article
Decomposition of socioeconomic inequalities in glaucoma knowledge in Taiwan -
Chiun-Ho Hou1,2
 , Christy Pu1
 -
Epidemiol Health 2024;46:e2024004.
DOI: https://doi.org/10.4178/epih.e2024004
Published online: December 5, 2023
1Institute of Public Health, National Yang Ming Chiao Tung University School of Medicine, Taipei, Taiwan
2Department of Ophthalmology, National Taiwan University Hospital, Taipei, Taiwan
- Correspondence: Christy Pu Institute of Public Health, National Yang Ming Chiao Tung University School of Medicine, 155 Section 2, Li-Nong Street, Taipei 112, Taiwan E-mail: cypu@nycu.edu.tw
• Received: July 22, 2023 • Accepted: October 19, 2023
© 2024, Korean Society of Epidemiology
This is an open-access article distributed under the terms of the Creative Commons Attribution License (http://creativecommons.org/licenses/by/4.0/), which permits unrestricted use, distribution, and reproduction in any medium, provided the original work is properly cited.
- 9,335 Views
- 122 Download
- 1 Crossref

Figure & Data
References
Citations
Citations to this article as recorded by 
- Association between Household Income and Glaucoma Prevalence in South Korea: A SMOTE-Enhanced Analysis of KNHANES 2021
So Yeon Kim, Chae Hyun Song, Kyoung Hae Kang, Se Hie Park, Jaekyoung Lee, Jie James Sng, Sooyeon Choe, Jin Wook Jeoung, Ki Ho Park, Young Kook Kim
Advances in Glaucoma.2025; 14(1): 34. CrossRef
 PubReader
 ePub Link
 Cite
CiteDecomposition of socioeconomic inequalities in glaucoma knowledge in Taiwan
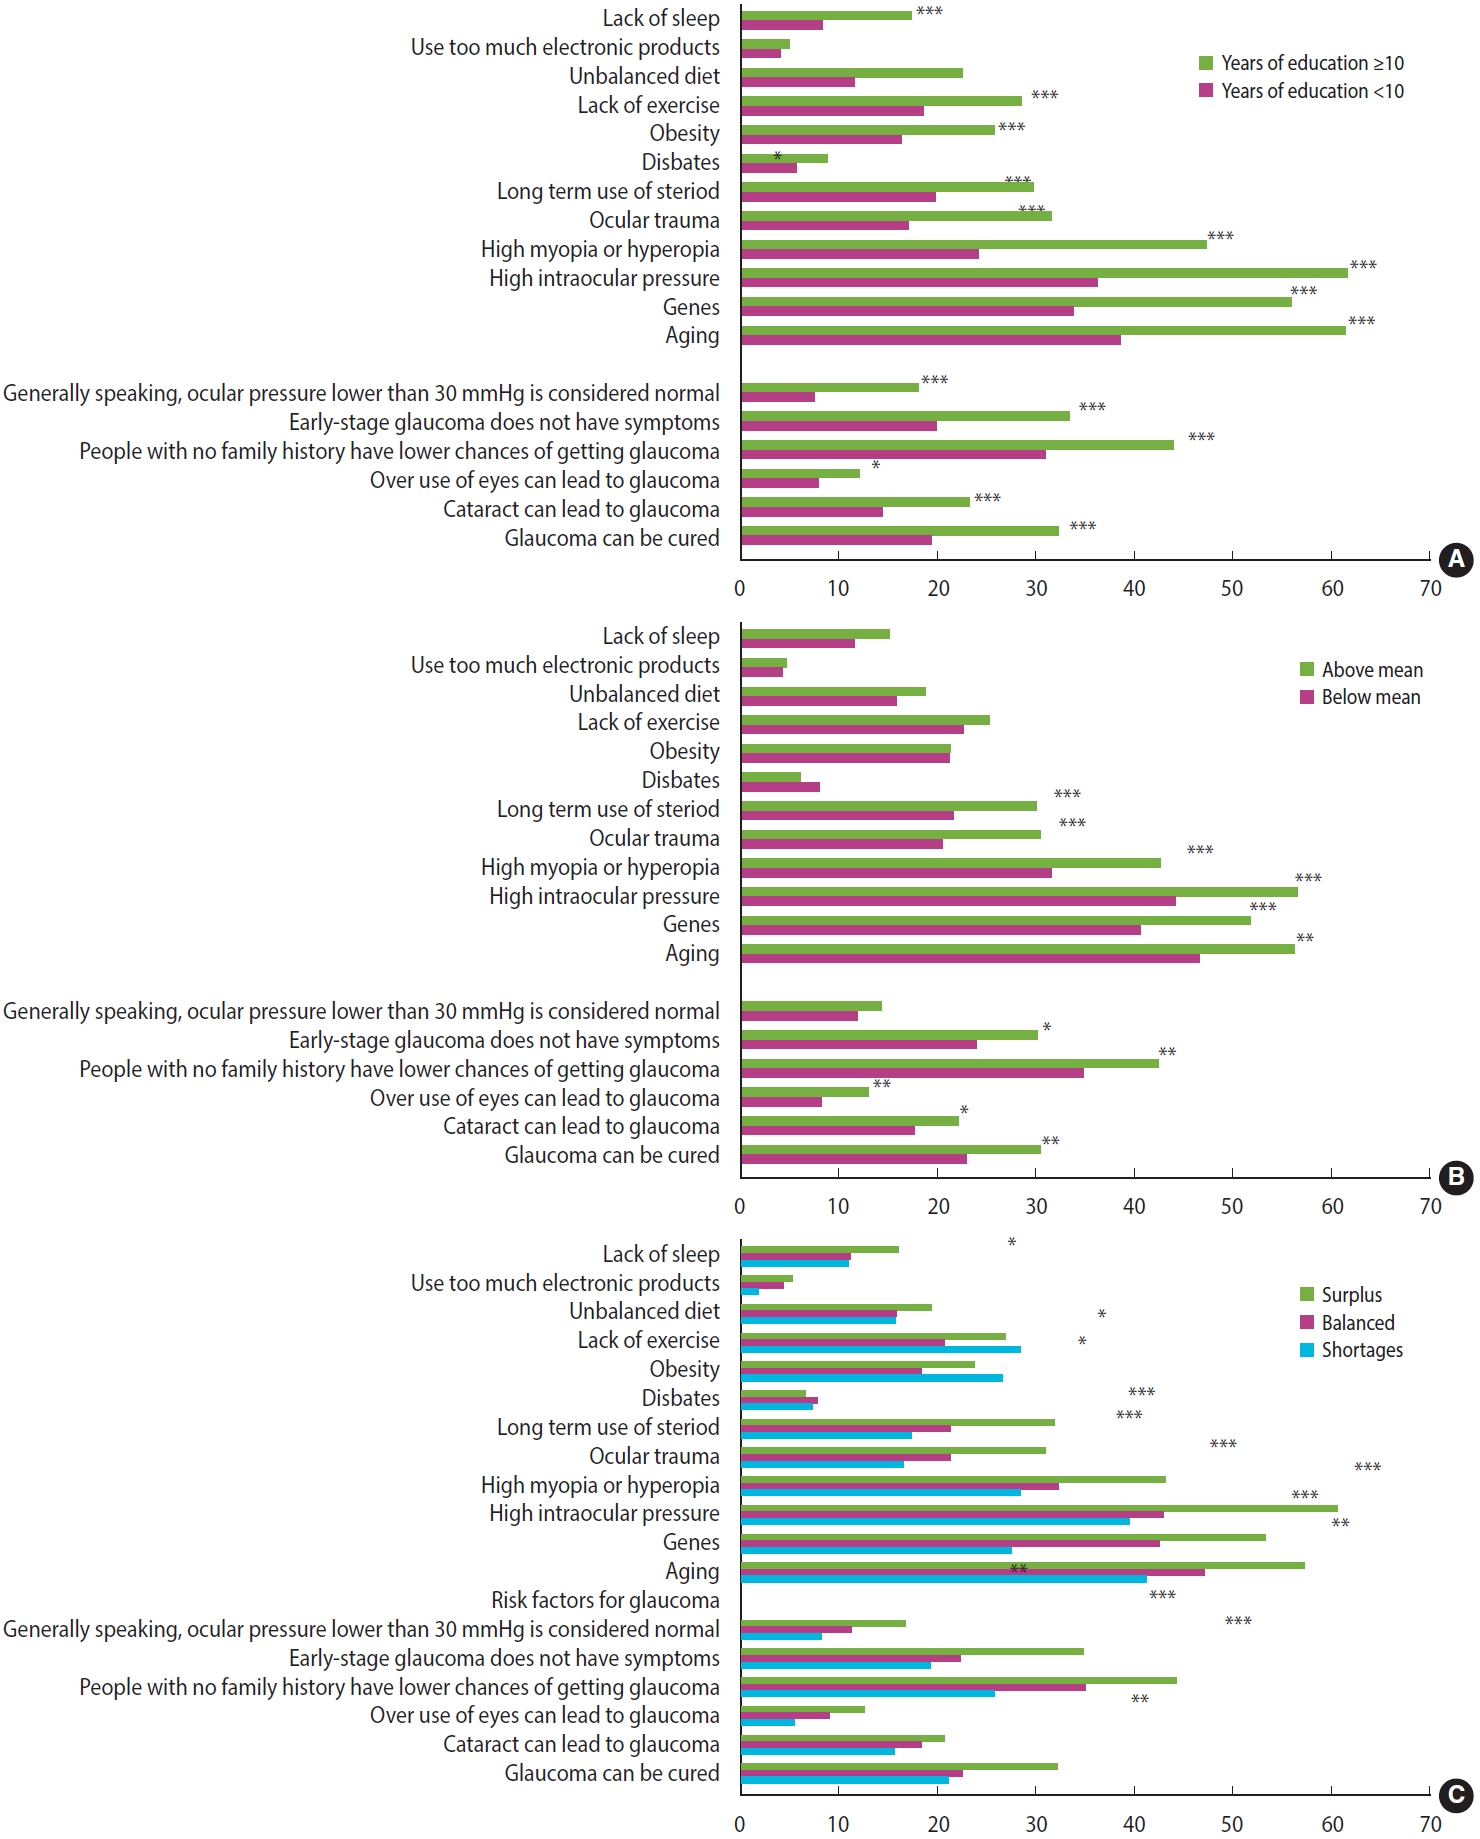
Figure 1. Glaucoma knowledge by (A) education, (B) income, and (C) self-rated financial status. *p<0.05, **p<0.01, ***p<0.001.
Figure 1.
Decomposition of socioeconomic inequalities in glaucoma knowledge in Taiwan
| Characteristics | Years of education |
p-value | |
|---|---|---|---|
| <10 yr (n=583) | ≥10 yr (n=620) | ||
| Age (yr) | 72.6±8.33 | 53.1±14.67 | <0.001 |
| Sex (male) | 135 (23.2) | 331 (53.4) | <0.001 |
| Marital status | <0.001 | ||
| Never married | 22 (3.8) | 168 (27.1) | |
| Married/cohabiting | 441 (75.6) | 450 (72.6) | |
| Widowed/separated | 120 (20.6) | 2 (0.3) | |
| Self-rated financial status | <0.001 | ||
| Lots of surplus | 1 (0.2) | 32 (5.2) | |
| Some surplus | 108 (18.5) | 313 (50.5) | |
| Balanced | 400 (68.6) | 240 (38.7) | |
| Some shortage | 63 (10.8) | 32 (5.2) | |
| Considerable shortage | 11 (1.9) | 3 (0.5) | |
| Place of residence (Taipei=1) | 167 (28.6) | 175 (28.2) | 0.872 |
| Employment | <0.001 | ||
| Employed | 25 (4.3) | 396 (63.9) | |
| Unemployed | 24 (4.1) | 35 (3.6) | |
| Retired | 534 (91.6) | 189 (30.5) | |
| Self-rated health | <0.001 | ||
| Very good | 9 (1.5) | 22 (3.5) | |
| Good | 54 (9.3) | 135 (21.8) | |
| Average | 138 (23.7) | 227 (36.6) | |
| Poor | 282 (48.4) | 203 (32.7) | |
| Very poor | 100 (17.1) | 33 (5.3) | |
| Weight | 0.140 | ||
| Underweight | 20 (3.4) | 33 (5.3) | |
| Normal weight | 354 (60.7) | 388 (62.6) | |
| Overweight | 171 (29.3) | 172 (27.7) | |
| Obese | 38 (6.5) | 27 (4.3) | |
| Smoking status | <0.001 | ||
| Never smoked | 502 (86.1) | 445 (71.8) | |
| Smoke | 21 (3.6) | 57 (9.2) | |
| Ex-smoker | 60 (10.3) | 118 (19.0) | |
| Glaucoma (yes=1) | 89 (15.3) | 103 (16.6) | 0.524 |
| Cataract (yes=1) | 350 (60.0) | 214 (34.5) | <0.001 |
| Self-perceived glaucoma risk | 0.001 | ||
| Very high risk | 10 (1.7) | 12 (1.9) | |
| Average risk | 7 (1.2) | 22 (3.5) | |
| Low risk | 155 (26.6) | 204 (32.9) | |
| No idea | 346 (59.3) | 297 (42.9) | |
| Already have glaucoma/blind | 65 (11.1) | 85 (13.7) | |
| Worry about current vision health | <0.001 | ||
| Very worried | 72 (12.3) | 80 (12.9) | |
| Worried | 215 (36.9) | 305 (49.2) | |
| Not worried | 296 (50.8) | 235 (37.9) | |
| Insurable income | 27,066.64±27,987.98 | 40,371.45±35,078.34 | <0.001 |
| Annual outpatient ophthalmology visits | 3.70±4.27 | 2.94±4.46 | 0.002 |
| Variables | Concentration index | Standard error | p-value |
|---|---|---|---|
| Years of education | |||
| General glaucoma knowledge | 0.159 | 0.017 | <0.001 |
| Knowledge of glaucoma risk factors | 0.168 | 0.014 | <0.001 |
| Overall glaucoma knowledge score | 0.166 | 0.014 | <0.001 |
| Income (1,249-182,000 New Taiwan dollars) | |||
| General glaucoma knowledge | 0.087 | 0.017 | <0.001 |
| Knowledge of glaucoma risk factors | 0.070 | 0.015 | <0.001 |
| Overall glaucoma knowledge score | 0.075 | 0.014 | <0.001 |
| Satisfaction with current financial status | |||
| General glaucoma knowledge | 0.093 | 0.016 | <0.001 |
| Knowledge of glaucoma risk factors | 0.075 | 0.013 | <0.001 |
| Overall glaucoma knowledge score | 0.080 | 0.013 | <0.001 |
| SES measures | Marginal effect | Education |
Self-perceived financial status |
Income |
|||
|---|---|---|---|---|---|---|---|
| Concentration index | % of contribution | Concentration index | % of contribution | Concentration index | % of contribution | ||
| Years of education | 0.444 | 0.153 | 94.56 | 0.058 | 75.40 | 0.043 | 58.55 |
| Self-rated financial status | |||||||
| Surplus (reference) | |||||||
| Balanced | -0.325 | -0.161 | 3.72 | -0.286 | 13.95 | -0.018 | 0.92 |
| Shortages | -0.496 | -0.314 | 1.90 | -0.909 | 11.58 | -0.172 | 2.29 |
| Income (mean, SD) | 0.000 | 0.146 | 6.21 | 0.075 | 6.71 | 0.485 | 45.48 |
| Age (mean, SD) | -0.018 | -0.113 | 16.96 | -0.007 | 2.22 | -0.035 | 11.53 |
| Sex (male) | 0.652 | -0.064 | -8.95 | -0.006 | -1.73 | -0.011 | -3.50 |
| Marital status | |||||||
| Never married (reference) | |||||||
| Married/cohabiting | 0.487 | -0.013 | -0.62 | 0.025 | 2.56 | 0.029 | 3.08 |
| Widowed/separated | 1.583 | -0.802 | -17.15 | -0.130 | -5.83 | -0.208 | -9.78 |
| Place of residence (Taipei=1) | 0.190 | -0.007 | -0.07 | 0.041 | 0.78 | 0.044 | 0.88 |
| Employment | |||||||
| Employed | |||||||
| Unemployed | 0.124 | 0.079 | 0.06 | -0.208 | -0.36 | -0.153 | -0.28 |
| Retired | 0.201 | -0.323 | -5.21 | -0.039 | -1.31 | -0.141 | -5.01 |
| Self-rated health | |||||||
| Very good (reference) | |||||||
| Good | -0.183 | 0.276 | -1.05 | 0.171 | -1.37 | 0.109 | -0.91 |
| Average | 0.069 | 0.116 | 0.32 | 0.056 | 0.33 | 0.022 | 0.13 |
| Poor | -0.082 | -0.100 | 0.45 | -0.064 | 0.61 | -0.054 | 0.54 |
| Very poor | 0.340 | -0.413 | -2.07 | -0.198 | -2.08 | -0.067 | -0.74 |
| Weight | |||||||
| Underweight | -1.111 | 0.150 | -0.97 | 0.080 | -1.09 | -0.009 | 0.13 |
| Normal weight (reference) | |||||||
| Overweight | -0.134 | -0.043 | 0.22 | -0.040 | 0.44 | 0.001 | -0.01 |
| Obese | -0.277 | -0.155 | 0.31 | -0.083 | 0.35 | -0.007 | 0.03 |
| Smoking status | |||||||
| Never smoked (reference) | |||||||
| Smoke | -0.466 | 0.226 | -0.91 | -0.126 | 1.07 | -0.068 | 0.61 |
| Ex-smoker | 0.040 | 0.160 | 0.13 | 0.036 | 0.06 | 0.003 | 0.00 |
| Glaucoma (yes=1) | 1.128 | -0.010 | -0.25 | -0.010 | -0.48 | -0.010 | -0.51 |
| Cataract (yes=1) | -0.181 | -0.190 | 2.18 | -0.016 | 0.39 | -0.050 | 1.26 |
| Self-perceived glaucoma risk | |||||||
| High/medium | 1.294 | 0.237 | 1.82 | -0.011 | -0.17 | 0.091 | 1.54 |
| Worry about current vision health | |||||||
| Very worried (reference) | |||||||
| Worried | 0.387 | 0.096 | 2.18 | 0.017 | 0.83 | 0.034 | 1.68 |
| Not worried | -0.300 | -0.093 | 1.63 | 0.011 | -0.40 | -0.027 | 1.04 |
| Annual ophthalmology outpatient visits | -0.016 | -0.088 | 0.61 | -0.021 | 0.31 | -0.062 | 0.95 |
Table 1. Participant characteristics (n=1,203)
Values are presented as number (%) or mean±standard deviation.
Table 2. Concentration index based on different socioeconomic status measures
Table 3. Decomposition of inequality in glaucoma knowledge by socioeconomic measures
SES, socioeconomic status; SE, standard error.

