
Articles
- Page Path
- HOME > Epidemiol Health > Volume 33; 2011 > Article
-
Original Article
Using Bayesian Networks to Model Hierarchical Relationships in Epidemiological Studies - Georges Nguefack-Tsague
-
Epidemiol Health 2011;33:e2011006.
DOI: https://doi.org/10.4178/epih/e2011006
Published online: June 17, 2011
Department of Public Health, Faculty of Medicine and Biomedical Sciences, University of Yaoundé I, Yaoundé, Cameroon.
- Correspondence: Georges Nguefack-Tsague, PhD. Department of Public Health, Faculty of Medicine and Biomedical Sciences, University of Yaoundé I, P. O. Box 1364 Yaoundé, Cameroon. Tel: +237 77-67-3665, Fax: +237 22-03-8843, nguefacktsague@yahoo.fr
• Received: February 22, 2011 • Accepted: May 25, 2011
© 2011, Korean Society of Epidemiology
This is an open-access article distributed under the terms of the Creative Commons Attribution License (http://creativecommons.org/licenses/by/3.0), which permits unrestricted use, distribution, and reproduction in any medium, provided the original work is properly cited.
- 56,989 Views
- 123 Download
- 12 Crossref

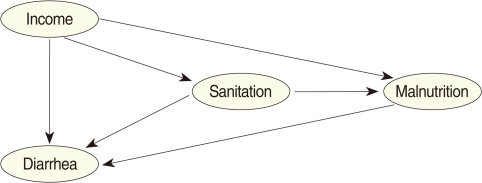
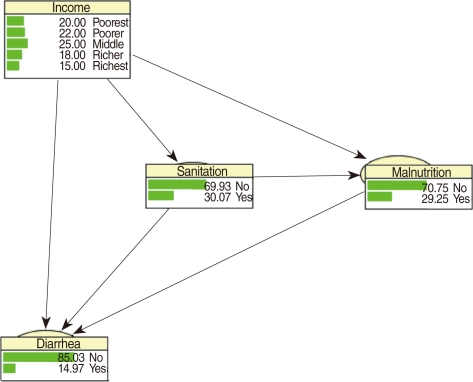
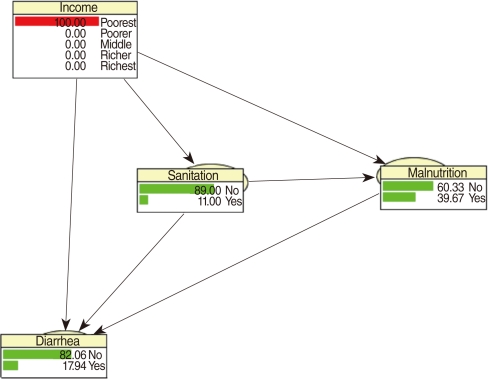

Figure & Data
References
Citations
Citations to this article as recorded by 
- Predicting COVID-19 community infection relative risk with a Dynamic Bayesian Network
Daniel P. Johnson, Vijay Lulla
Frontiers in Public Health.2022;[Epub] CrossRef - Study design synopsis: Battle in the stable: Bayesianism versus Frequentism
Johann Detilleux
Equine Veterinary Journal.2021; 53(2): 199. CrossRef - Learning Bayesian networks from demographic and health survey data
Neville Kenneth Kitson, Anthony C. Constantinou
Journal of Biomedical Informatics.2021; 113: 103588. CrossRef - Novel statistical approaches to identify risk factors for soil-transmitted helminth infection in Timor-Leste
Jessica Yi Han Aw, Naomi E. Clarke, Helen J. Mayfield, Colleen L. Lau, Alice Richardson, Susana Vaz Nery
International Journal for Parasitology.2021; 51(9): 729. CrossRef - Using Bayesian Networks to Predict Long-Term Health-Related Quality of Life and Comorbidity after Bariatric Surgery: A Study Based on the Scandinavian Obesity Surgery Registry
Yang Cao, Mustafa Raoof, Eva Szabo, Johan Ottosson, Ingmar Näslund
Journal of Clinical Medicine.2020; 9(6): 1895. CrossRef - Can dementia be predicted using olfactory identification test in the elderly? A Bayesian network analysis
Ding Ding, Xiaoniu Liang, Zhenxu Xiao, Wanqing Wu, Qianhua Zhao, Yang Cao
Brain and Behavior.2020;[Epub] CrossRef - Development of a multivariable predictive model for postoperative nausea and vomiting after cancer surgery in adults
Léia Alessandra Pinto Yamada, Gabriel Magalhães Nunes Guimarães, Magda Aparecida Santos Silva, Angela Maria Sousa, Hazem Adel Ashmawi
Brazilian Journal of Anesthesiology (English Edition).2019; 69(4): 342. CrossRef - Desenvolvimento de um modelo preditivo multivariado para náusea e vômito no pós‐operatório de cirurgia oncológica em adultos
Léia Alessandra Pinto Yamada, Gabriel Magalhães Nunes Guimarães, Magda Aparecida Santos Silva, Angela Maria Sousa, Hazem Adel Ashmawi
Brazilian Journal of Anesthesiology.2019; 69(4): 342. CrossRef - Unravelling infectious disease eco-epidemiology using Bayesian networks and scenario analysis: A case study of leptospirosis in Fiji
Colleen L. Lau, Helen J. Mayfield, John H. Lowry, Conall H. Watson, Mike Kama, Eric J. Nilles, Carl S. Smith
Environmental Modelling & Software.2017; 97: 271. CrossRef - A Mixture-Based Bayesian Model Averaging Method
Georges Nguefack-Tsague, Walter Zucchini
Open Journal of Statistics.2016; 06(02): 220. CrossRef - Effects of Bayesian Model Selection on Frequentist Performances: An Alternative Approach
Georges Nguefack-Tsague, Walter Zucchini
Applied Mathematics.2016; 07(10): 1103. CrossRef - Frequentist Model Averaging and Applications to Bernoulli Trials
Georges Nguefack-Tsague, Walter Zucchini, Siméon Fotso
Open Journal of Statistics.2016; 06(03): 545. CrossRef
 PubReader
 ePub Link
 Cite
CiteUsing Bayesian Networks to Model Hierarchical Relationships in Epidemiological Studies


Figure 1 Bayesian network: a simplified conceptual hierarchical framework for diarrhea.
Figure 2 Frequency network showing posterior probabilities (%).
Figure 3 Frequency network showing posterior probabilities (%) when there is evidence that the child belongs to a family in the poorest quintile.
Figure 4 Frequency network showing posterior probabilities (%) of developing diarrhea when there is evidence that the child belongs to family in the poorest quintile, has poor sanitation conditions and is malnourished.
Figure 1
Figure 2
Figure 3
Figure 4
Using Bayesian Networks to Model Hierarchical Relationships in Epidemiological Studies
| Coefficient | SE | z-value | p-value | |
|---|---|---|---|---|
| LR1 | ||||
| Residual deviance = 2338.9, df = 2738, AIC = 2342.9 | ||||
| Intercept | -1.32 | 0.12 | -10.86 | < 0.001 |
| Income | -0.14 | 0.04 | -3.43 | < 0.001 |
| LR2 | ||||
| Residual deviance = 2336.5, df = 2737, AIC = 2342.5 | ||||
| Intercept | -1.34 | 0.12 | -10.93 | < 0.001 |
| Income | -0.15 | 0.04 | -3.66 | < 0.001 |
| Sanitation | 0.18 | 0.08 | 2.23 | 0.01 |
| LR3 | ||||
| Residual deviance = 2333.1, df = 2736, AIC = 2341.1 | ||||
| Intercept | 1.45 | 0.14 | -10.58 | < 0.001 |
| Income | -0.14 | 0.04 | -3.29 | < 0.001 |
| Sanitation | 0.19 | 0.09 | 2.68 | 0.01 |
| Malnutrition | 0.21 | 0.09 | 2.31 | 0.01 |
| Malnutrition | Sanitation | Income | Diarrhea |
|
|---|---|---|---|---|
| No | Yes | |||
| No | No | Poorest | 0.83 | 0.17 |
| Poorer | 0.90 | 0.10 | ||
| Middle | 0.88 | 0.12 | ||
| Richer | 0.84 | 0.16 | ||
| Richest | 0.89 | 0.11 | ||
| Yes | Poorest | 0.86 | 0.14 | |
| Poorer | 0.90 | 0.10 | ||
| Middle | 0.83 | 0.17 | ||
| Richer | 0.79 | 0.21 | ||
| Richest | 0.86 | 0.14 | ||
| Yes | No | Poorest | 0.80 | 0.20 |
| Poorer | 0.84 | 0.16 | ||
| Middle | 0.79 | 0.21 | ||
| Richer | 0.82 | 0.18 | ||
| Richest | 0.94 | 0.06 | ||
| Yes | Poorest | 0.81 | 0.19 | |
| Poorer | 0.80 | 0.20 | ||
| Middle | 0.79 | 0.21 | ||
| Richer | 0.88 | 0.12 | ||
| Richest | 0.78 | 0.22 | ||
| Income | Sanitation |
|
|---|---|---|
| No | Yes | |
| Poorest | 0.89 | 0.11 |
| Poorer | 0.67 | 0.33 |
| Middle | 0.67 | 0.33 |
| Richer | 0.58 | 0.42 |
| Richest | 0.68 | 0.32 |
| Income | Proportion |
|---|---|
| Poorest | 0.20 |
| Poorer | 0.22 |
| Middle | 0.25 |
| Richer | 0.18 |
| Richest | 0.15 |
| Sanitation | Income | Malnutrition |
|
|---|---|---|---|
| No | Yes | ||
| No | Poorest | 0.60 | 0.40 |
| Poorer | 0.88 | 0.12 | |
| Middle | 0.63 | 0.37 | |
| Richer | 0.62 | 0.38 | |
| Richest | 0.77 | 0.23 | |
| Yes | Poorest | 0.63 | 0.37 |
| Poorer | 0.87 | 0.13 | |
| Middle | 0.67 | 0.33 | |
| Richer | 0.70 | 0.30 | |
| Richest | 0.77 | 0.23 | |
| Factors | Empirical | Adjusted (Bf |
|---|---|---|
| Sanitation | ||
| Yes | 31.24 | 30.07 |
| No | 68.76 | 69.93 |
| Malnutrition | ||
| Yes | 30.62 | 29.25 |
| No | 69.38 | 70.75 |
| Diarrhea | ||
| Yes | 15.36 | 14.97 |
| No | 84.64 | 85.03 |
Table 1 Logistic regression estimates and model summaries
SE, standard error; df, degree of freedom; AIC, Akaike information criterion.
Table 2 CPT for terminal node diarrhea
CPT, conditional probability table.
Table 3 CPT for sanitation
CPT, conditional probability table.
Table 4 MPT for income
MPT, marginal probability table.
Table 5 CPT for malnutrition
CPT, conditional probability table.
Table 6 Comparison frequencies (%) from the data and the adjusted frequencies (BN)
BN, Bayesian network.

