
Articles
- Page Path
- HOME > Epidemiol Health > Volume 38; 2016 > Article
-
Original Article
Trends in gastrointestinal cancer incidence in Iran, 2001-2010: a joinpoint analysis -
Mehdi Darabi1
 , Mohsen Asadi Lari1,2, Seyed Abbas Motevalian1, Ali Motlagh3, Shahram Arsang-Jang4, Maryam Karimi Jaberi1
 -
Epidemiol Health 2016;38:e2016056.
DOI: https://doi.org/10.4178/epih.e2016056
Published online: December 5, 2016
1Department of Epidemiology, School of Public Health, Iran University of Medical Sciences, Tehran, Iran
2Oncopathology Research Center, Iran University of Medical Sciences, Tehran, Iran
3Department of Radiotherapy, Shahid Baheshti University of Medical Sciences, Tehran Iran
4Department of Epidemiology and Biostatistics, Faculty of Health, Qom University of Medical Sciences, Qom, Iran
- Correspondence: Mohsen Asadi Lari Department of Epidemiology, School of Public Health, Iran University of Medical Sciences. Shahid Hemmat Highway, Tehran 1449614535, Iran Tel: +98-2186703209, Fax: +98-2188622608, E-mail: mohsen.asadi@yahoo.com
©2016, Korean Society of Epidemiology
This is an open-access article distributed under the terms of the Creative Commons Attribution License (http://creativecommons.org/licenses/by/4.0/), which permits unrestricted use, distribution, and reproduction in any medium, provided the original work is properly cited.
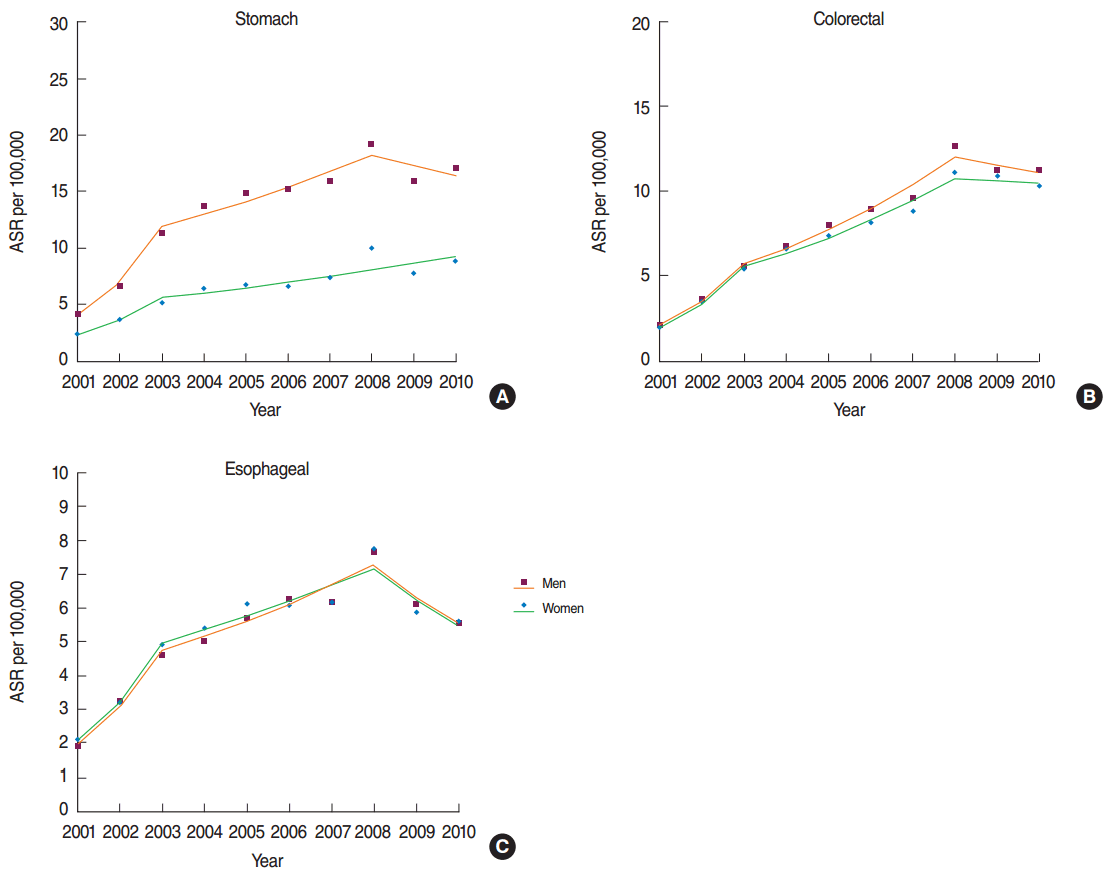

Figure & Data
References
Citations
- Prevalence, trends, and characteristics of metabolic dysfunction-associated steatotic liver disease among the US population aged 12–79 years
Tsung-Hua Shen, Chung-Hsuen Wu, Yuan-Wen Lee, Chun-Chao Chang
European Journal of Gastroenterology & Hepatology.2024; 36(5): 636. CrossRef - Prevalence, trends, and characteristics of polypharmacy among US pregnant women aged 15 to 44 years: NHANES 1999 to 2016
Yu-Chien Chang, Hsin-Yi Huang, Tsung-Hua Shen, Chung-Hsuen Wu
Medicine.2023; 102(22): e33828. CrossRef - THE EFFECT OF PASSIVE MUSIC THERAPY ON THE QUALITY OF LIFE OF FAMILY CAREGIVERS OF CANCER PATIENTS UNDERGOING CHEMOTHERAPY REFERRING TO IMAM KHOMEINI UNIVERSITY HOSPITAL AT URMIA, IRAN IN 2022
Samereh Eghtedar, Moloud Radfar, Yasin Shafipour, Vahid Alinejad
Nursing and Midwifery Journal.2023; 20(12): 1014. CrossRef - Investigating Trends of Incidence Rates of Esophageal Cancer Divided by Squamous Cell Carcinoma and Adenocarcinoma in Southern Iran: a 10-Year Experience
Mahnaz Hosseini-Bensenjan, Hossein Molavi Vardanjani, Sezaneh Haghpanah, Zahra Khosravizadegan, Kamran Bagheri-Lankarani
Journal of Gastrointestinal Cancer.2022; 53(1): 230. CrossRef - Gastrointestinal Cancer Prevention Policies
Neda Kabiri, Rahim Khodayari-zarnaq, Manouchehr Khoshbaten, Ali Janati
International Journal of Preventive Medicine.2022; 13(1): 8. CrossRef - A cost-effectiveness modeling study of treatment interventions for stage I to III esophageal squamous cell carcinoma
Rajabali Daroudi, Azin Nahvijou, Mohammad Arab, Ahmad Faramarzi, Bita Kalaghchi, Ali Akbari Sari, Javad Javan-Noughabi
Cost Effectiveness and Resource Allocation.2022;[Epub] CrossRef - Significant Association of Variable Number Tandem Repeat Polymorphism rs58335419 in the MIR137 Gene With the Risk of Gastric and Colon Cancers
Pegah Jafari, Sedighe Baghernia, Mehdi Moghanibashi, Parisa Mohamadynejad
British Journal of Biomedical Science.2022;[Epub] CrossRef - Mortality Trends of Gastrointestinal, Liver, and Pancreaticobiliary Diseases: A Hospital-Based Prospective Study in the Southeast of Iran
Mohammad Javad Zahedi, Sara Shafieipour, Mohammad Mahdi Hayatbakhsh Abbasi, Mohsen Nakhaie, Mohammad Rezaei Zadeh Rukerd, Mohammad Mehdi Lashkarizadeh, Farbood Noorbini, Mohammad Hasan Baghaei, Abbas Pourjafari, Ebrahim Aminian, Fatemeh Karami Robati, Aza
Middle East Journal of Digestive Diseases.2022; 14(4): 404. CrossRef - Predictors of Colorectal Cancer Screening Participation in Southern Khorasan (Iran)
Abbas Ali Ramazani, Ensiyeh Norozi, Hassan AmirabadiZadeh, Ali Reza Ehteshampour, Hamid Salehiniya
Journal of Gastrointestinal Cancer.2021; 52(1): 187. CrossRef - Incidence and Risk Factors of Colorectal Cancer in the Iranian Population: a Systematic Review
Hossein Mozafar Saadati, Batool Okhovat, Farzad Khodamoradi
Journal of Gastrointestinal Cancer.2021; 52(2): 414. CrossRef - Serum level of programmed death-ligand 1 in patients with gastric cancer in Mazandaran Province as a High-Risk Region in Iran
Ramin Shekarriz, Akbar Hedayatizadeh-Omran, Omolbanin Amjadi, Reza Alizadeh-Navaei, Gholamali Godazandeh
Clinical Cancer Investigation Journal.2021; 10(1): 5. CrossRef - Trend of Gastric Cancer Incidence in an Area Located in the Center of Iran: 2009–2014
Rahmatollah Moradzadeh, Ali Arash Anoushirvani
Journal of Gastrointestinal Cancer.2020; 51(1): 159. CrossRef - Descriptive Epidemiology of Brain and Central Nervous System Tumours: Results from Iran National Cancer Registry, 2010-2014
Amir Salimi, Alireza Zali, Amir Saeid Seddighi, Afsoun Seddighi, Shakila Meshkat, Morteza Hosseini, Amir Nikouei, Mohammad Esmaeil Akbari
Journal of Cancer Epidemiology.2020; 2020: 1. CrossRef Epidemiologic Study of Gastric Cancer in Iran: A Systematic Review
Khadijeh Kalan Farmanfarma, Neda Mahdavifar, Soheil Hassanipour, Hamid Salehiniya
Clinical and Experimental Gastroenterology.2020; Volume 13: 511. CrossRef- Prevalence and demographic characteristics of cancers
Zahra Tolou-Ghamari
Clinical Cancer Investigation Journal.2020; 9(1): 13. CrossRef - Incidence of Esophageal Cancer in Iran, a Population-Based Study: 2001–2015
Rahmatollah Moradzadeh, Parvaneh Golmohammadi, Bahman Ghaitasi, Haidar Nadrian, Athareh Najafi
Journal of Gastrointestinal Cancer.2019; 50(3): 507. CrossRef - A 12-year trend analysis of the incidence of gastrointestinal cancers in East Azerbaijan: last updated results of an ongoing population-based cancer registry
Mohammad Hossein Somi, Roya Dolatkhah, Sepideh Sepahi, Mina Belalzadeh, Shahnaz Naghashi, Mohammad Asghari Jafarabadi
BMC Cancer.2019;[Epub] CrossRef - Trends and risk factors of gastric cancer in Iran (2005–2010)
Sedigheh Rastaghi, Tohid Jafari-Koshki, Behzad Mahaki, Yousef Bashiri, Kamran Mehrabani, Ali Soleimani
International Journal of Preventive Medicine.2019; 10(1): 79. CrossRef - Helicobacter pylori cagL amino acid polymorphism D58E59 pave the way toward peptic ulcer disease while N58E59 is associated with gastric cancer in north of Iran
Mina Rezaee Cherati, Javad Shokri-Shirvani, Ahmad Karkhah, Ramzan Rajabnia, Hamid Reza Nouri
Microbial Pathogenesis.2017; 107: 413. CrossRef
 PubReader
 ePub Link
 Cite
Cite

Figure 1.
Figure 2.
| Cancer site | Men |
Women |
||||||||||||
|---|---|---|---|---|---|---|---|---|---|---|---|---|---|---|
| 2001 |
2010 |
2001 |
2010 |
|||||||||||
| No. of cases | CR | ASR | No. of cases | CR | ASR | APC | No. of cases | CR | ASR | No. of cases | CR | ASR | APC | |
| Stomach | 1,105 | 3.3 | 4.18 | 5,192 | 13.2 | 17.06 | 16.7 |
484 | 1.5 | 2.41 | 2,238 | 6.5 | 8.85 | 16.2 |
| Colorectal | 379 | 1.3 | 2.12 | 3,443 | 8.8 | 11.28 | 20.0 |
344 | 1.2 | 2.00 | 2,641 | 7.7 | 10.33 | 20.0 |
| Esophageal | 858 | 2.5 | 3.25 | 1,693 | 4.3 | 5.57 | 12.0 |
405 | 1.3 | 2.10 | 1,378 | 4.0 | 5.62 | 11.2 |
| Cancer site, age | APC (95% Cl) 2001-2010 | Trend 1 | APC (95% CI) | Trend 2 | APC (95% CI) | Trend 3 | APC (95% CI) |
|---|---|---|---|---|---|---|---|
| Men | |||||||
| Stomach | |||||||
| 40-49 | 12.4 (0.6, 25.7) | 2001-2003 | 54.2 (-21.8, 204.0) | 2003-2008 | 11.9 (-9.7, 38.7) | 2008-2010 | -17 (-57.9, 63.7) |
| 50-59 | 9.8 (6.3, 13.3) | 2001-2003 | 41.4 (16.4, 71.7) | 2003-2008 | 10.2 (3.6, 17.2) | 2008-2010 | -15.6 (-30.5, 2.5) |
| 60-69 | 12.3 (6.5, 18.4) |
2001-2003 | 41.5 (6.5, 88.0) |
2003-2010 | 5.1 (1.2, 9.2) | N/A | N/A |
| 70-79 | 16.6 (12.4, 21.0) | 2001-2003 | 63.4 (30.6, 104.4) | 2003-2008 | 9.6 (2.1, 17.6) | 2008-2010 | -2.9 (-22.3, 21.5) |
| 80+ | 23.7 (14.3, 33.9) | 2001-2004 | 63.6 (26.3, 112.0) | 2004-2010 | 7.6 (-1.5, 17.4) | N/A | N/A |
| All | 16.7 (14.6, 18.8) |
2001-2003 | 70.4 (52.6, 90.3) |
2003-2008 | 8.9 (5.1, 12.8) |
2008-2010 | -5.1 (-15.0, 6.0) |
| Colorectal | |||||||
| 40-49 | 13.0 (10.4, 15.6) |
2001-2003 | 46.7 (27.6, 68.6) |
2003-2008 | 15.1 (10.1, 20.3) |
2008-2010 | -16.9 (-27.7, -4.5) |
| 50-59 | 17.2 (11.8, 22.8) |
2001-2003 | 52.9 (15.0, 103.3) |
2003-2008 | 17.6 (7.5, 28.7) |
2008-2010 | -11.0 (-33.1, 18.3) |
| 60-69 | 24.2 (16.1, 32.9) |
2001-2003 | 62.3 (13.1, 133.1) |
2003-2010 | 15.1 (9.7, 20.8) |
N/A | N/A |
| 70-79 | 21.0 (15.4, 26.9) |
2001-2004 | 43.1 (22.7, 66.9) |
2004-2010 | 11.3 (5.6, 17.2) |
N/A | N/A |
| 80+ | 21.2 (11.9, 31.3) |
2001-2007 | 35.9 (24.4.8, 48.4) |
2007-2010 | -3.6 (-25.7, 25.2) | N/A | N/A |
| All | 20.0 (15.6, 24.6) |
2001-2003 | 63.3 (30.0, 105.1) |
2003-2008 | 15.9 (7.8, 24.5) |
2008-2010 | -3.8 (-23.4, -0.7) |
| Esophageal | |||||||
| 40-49 | 9.2 (-6.0, 26.8) | 2001-2004 | 42.8 (-10.0, 126.5) | 2004-2008 | 6.2 (-33.1, 38.4) | 2008-2010 | -22.9(-69.4, 94.1) |
| 50-59 | 12.5 (6.5, 18.8) |
2001-2003 | 64.3 (17.6, 129.6) |
2003-2008 | 10.8 (-0.3, 23.2) | 2008-2010 | -20 (-42.7.2, 11.7) |
| 60-69 | 14.3 (6.2, 23.1) |
2001-2003 | 57.7 (6.4, 133.7) |
2003-2010 | 4.3 (-1.0, 9.9) | N/A | N/A |
| 70-79 | 13.4 (5.2, 22.2) |
2001-2005 | 31.7 (11.6, 55.5) |
2005-2010 | 0.6 (-10.6, 13.1) | N/A | N/A |
| 80+ | 17.5 (6.4, 29.8) |
2001-2003 | 77.1 (-3.3, 224.4) | 2003-2008 | 15.5 (-4.6, 39.9) | 2008-2010 | -18.6 (-55.6, 49.0) |
| All | 12.0 (6.6, 17.7) |
2001-2003 | 54.6 (14.1, 109.4) |
2003-2008 | 8.9 (-1.1, 19.9) | 2008-2010 | -12.8 (-35.7, 18.1) |
| Women | |||||||
| Stomach | |||||||
| 40-49 | 12.1 (3.4, 21.6) | 2001-2004 | 38.3 (13.0, 69.3) | 2004-2008 | 12.3 (-6.3, 34.6) | 2008-2010 | -18.5 (-57.3, 55.3) |
| 50-59 | 14.6 (8.5, 21.0) | 2001-2004 | 35.8 (13.8, 62.1) | 2004-2010 | 5.3 (-0.9, 11.7) | N/A | N/A |
| 60-69 | 13.1 (5.9, 20.8) |
2001-2004 | 35.6 (9.5, 68.0) |
2004-2010 | 3.3 (-3.9, 11.0) | N/A | N/A |
| 70-79 | 16.1 (8.8, 23.9) | 2001-2003 | 40.1 (-1.2, 98.7) | 2003-2010 | 10.0 (5.0, 15.3) | N/A | N/A |
| 80+ | 18.6 (13.9, 23.5) | N/A | N/A | N/A | N/A | N/A | N/A |
| All | 16.2 (7.7, 25.4) |
2001-2003 | 53.3 (2.1, 130.1) |
2003-2010 | 7.4 (1.7, 13.4) |
N/A | N/A |
| Colorectal | |||||||
| 40-49 | 18.6 (8.3, 29.8) |
N/A | N/A | N/A | N/A | N/A | N/A |
| 50-59 | 25.1 (13.3, 38.2) |
2001-2003 | 69.3 (-0.3, 187.5) | 2003-2010 | 14.8 (6.9, 23.2) |
N/A | N/A |
| 60-69 | 19.5 (13.3, 26.1) |
2001-2004 | 52.8 (28.5, 81.8) |
2004-2010 | 5.7 (-0.3, 12.1) | N/A | N/A |
| 70-79 | 20.2 (15.5, 25.1) |
2001-2004 | 48.3 (30.1,69.1) |
2004-2010 | 8.2 (3.6, 13.1) |
N/A | N/A |
| 80+ | 23.0 (10.9, 36.6) |
2001-2004 | 60.4 (14.2, 125.3) |
2004-2010 | 7.8 (-3.9, 20.9) | - | - |
| All | 20.0 (18.8, 21.3) |
2001-2003 | 66.8 (56.4, 78.0) |
2003-2008 | 13.8 (11.5, 16.1) |
2008-2010 | -1.3 (-7.5, 5.3) |
| Esophageal | |||||||
| 40-49 | 6.5 (-1.8, 15.4) | 2001-2003 | 62.7 (-0.4, 165.9) | 2003-2008 | 1.9 (-1.7, 19.0) | 2008-2010 | -22.3 (-52.4, 27.0) |
| 50-59 | 14.0 (1.5, 28.2) |
2001-2003 | 52.8 (-18.2, 185.6) | 2003-2010 | 4.9 (-3.5, 14.0) | N/A | N/A |
| 60-69 | 13.9 (5.6, 22.9) |
2001-2003 | 70.8 (14.0, 155.8) |
2003-2010 | 1.5 (-3.9, 7.1) | N/A | N/A |
| 70-79 | 12.6 (3.7, 22.4) |
2001-2003 | 52.3 (-8.1, 152.5) | 2003-2008 | 9.7 (-6.5, 28.7) | 2008-2010 | -11.1 (-46.4, 47.4) |
| 80+ | 15.3 (4.9, 26.8) |
2001-2003 | 28.7 (20.2, 37.7) |
2003-2010 | -21.5(-52.7, 30.4) | N/A | N/A |
| All | 11.2 (6.2, 16.5) |
2001-2003 | 54.5 (16.7, 104.7) |
2003-2008 | 7.4 (-1.7, 17.4) | 2008-2010 | -12.7 (-34.1, 15.6) |
CR, crude rates (per 100,000); ASR, age-standardized incidence rates (per 100,000); APC, annual percent change of ASRs. p<0.05.
ASR, age-standardized incidence rate; APC, annual percentage change of ASRs; CI, confidence interval; N/A, not applicable. p<0.05.

