Articles
- Page Path
- HOME > Epidemiol Health > Volume 35; 2013 > Article
-
Original Article
The Relationship between Height and Cognitive Function among Community-dwelling Elderly: Hallym Aging Study - Shan Ai Quan1,2, Jin-Young Jeong3, Dong-Hyun Kim1,2
-
Epidemiol Health 2013;35:e2013002.
DOI: https://doi.org/10.4178/epih/e2013002
Published online: April 30, 2013
1Department of Social and Preventive Medicine, Hallym University College of Medicine, Chuncheon, Korea.
2Hallym Research Institute of Clinical Epidemiology, Chuncheon, Korea.
3Korea Health Promotion Foundation, Seoul, Korea.
- Correspondence: Dong-Hyun Kim, MD, PhD. Department of Social and Preventive Medicine, Hallym University College of Medicine, 39 Hallymdaehak-gil, Chuncheon 200-702, Korea. Tel: +82-33-248-2660, Fax: +82-33-256-1675, dhkims@hallym.ac.kr
© 2013, Korean Society of Epidemiology
This is an open-access article distributed under the terms of the Creative Commons Attribution License (http://creativecommons.org/licenses/by/3.0/), which permits unrestricted use, distribution, and reproduction in any medium, provided the original work is properly cited.
- 23,393 Views
- 97 Download
- 7 Crossref
Figure & Data
References
Citations

- Taller adult height is associated with better performance of cognitive trajectories in Chinese over 45 years old: Evidence from the China Health and Retirement Longitudinal Study
Lan Luo, Fangfei Xie, Yun Wang, Li‐Qiang Qin, Jie‐Yun Yin, Zhongxiao Wan
Geriatrics & Gerontology International.2021; 21(8): 732. CrossRef - Sex-related associations between body height and cognitive impairment among low-income elderly adults in rural China: a population-based cross-sectional study
Dongwang Qi, Chanhong Shi, Rongyan Mao, Xuewei Yang, Jinhui Song, Yanjia Wang, Jun Tu, Jinghua Wang, Xianjia Ning, Yi Wu
Biology of Sex Differences.2021;[Epub] CrossRef - Book-Oriented Environment in Childhood and Current Cognitive Performance among Old-Aged Europeans
Galit Weinstein, Ella Cohn-Schwartz, Noam Damri
Dementia and Geriatric Cognitive Disorders.2021; 50(3): 274. CrossRef - Host and disease factors are associated with cognitive function in European HIV‐infected adults prior to initiation of antiretroviral therapy
A Winston, W Stöhr, A Antinori, A Arenas‐Pinto, JM Llibre, H Amieva, A Cabié, I Williams, G Di Perri, MJ Tellez, J Rockstroh, A Babiker, A Pozniak, F Raffi, L Richert
HIV Medicine.2016; 17(6): 471. CrossRef - Adult Body Height Is a Good Predictor of Different Dimensions of Cognitive Function in Aged Individuals: A Cross-Sectional Study
Vitor H. Pereira, Patrício S. Costa, Nadine C. Santos, Pedro G. Cunha, Margarida Correia-Neves, Joana A. Palha, Nuno Sousa
Frontiers in Aging Neuroscience.2016;[Epub] CrossRef - Associations among height, body mass index and intelligence from age 11 to age 78 years
Mathew A. Harris, Caroline E. Brett, Ian J. Deary, John M. Starr
BMC Geriatrics.2016;[Epub] CrossRef - Body Mass Index, Height and Socioeconomic Position in Adolescence, Their Trajectories into Adulthood, and Cognitive Function in Midlife
Irit Cohen-Manheim, Glen M. Doniger, Ronit Sinnreich, Ely S. Simon, Havi Murad, Ronit Pinchas-Mizrachi, Jeremy D. Kark
Journal of Alzheimer's Disease.2016; 55(3): 1207. CrossRef


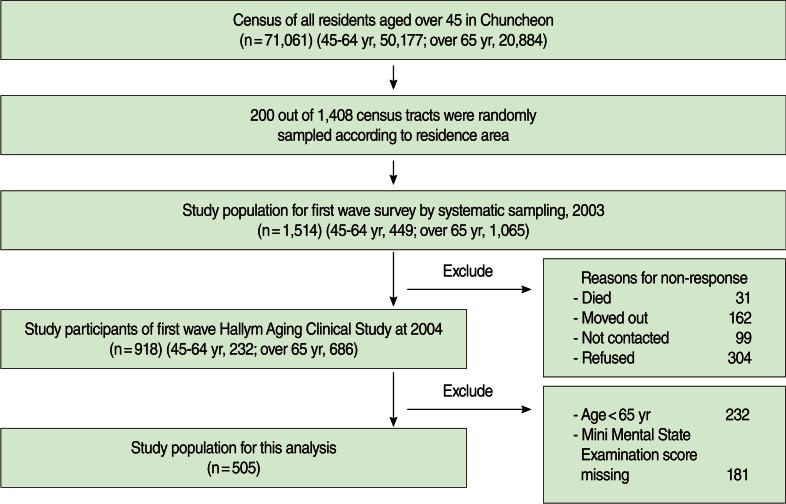
Figure 1
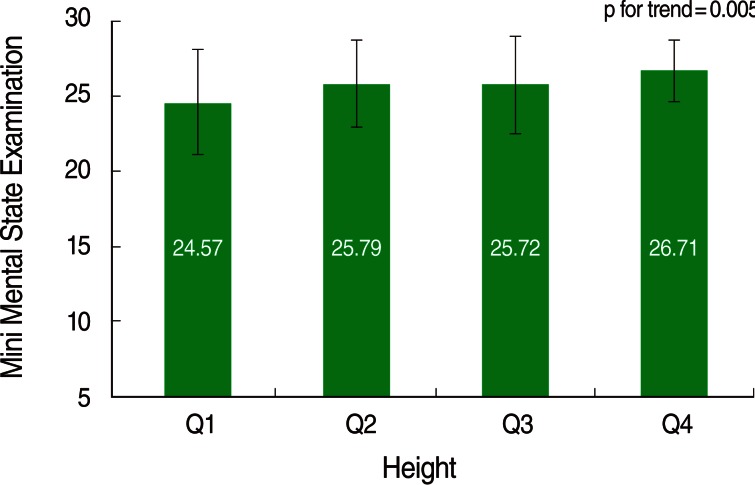
Figure 2
Figure 3
| Men |
Women |
||||||
|---|---|---|---|---|---|---|---|
| Cognitive impairment (n = 43) | Normal (n = 185) | p-value | Cognitive impairment (n = 146) | Normal (n = 131) | p-vlalue | ||
| Age (yr) | 65-69 | 11 (25.6) | 60 (32.4) | 0.25 | 35 (24.0) | 58 (44.3) | < 0.001 |
| 70-74 | 16 (37.2) | 79 (42.7) | 51 (34.9) | 41 (31.3) | |||
| ≥75 | 16 (37.2) | 46 (24.9) | 60 (41.1) | 32 (24.4) | |||
| Education (yr) | 0 | 13 (30.2) | 5 (2.7) | < 0.001 | 100 (68.5) | 10 (7.6) | < 0.001 |
| 1-5 | 16 (37.2) | 38 (20.5) | 37 (25.3) | 62 (47.3) | |||
| ≥6 | 14 (32.6) | 142 (76.8) | 9 (6.2) | 59 (45.0) | |||
| Smoking | None | 5 (11.6) | 46 (24.9) | 0.04 | 131 (89.7) | 119 (90.8) | 0.89 |
| Past | 21 (48.8) | 96 (51.9) | 6 (4.1) | 4 (3.1) | |||
| Current | 17 (39.5) | 43 (23.2) | 9 (6.2) | 8 (6.1) | |||
| Drinking | None | 7 (16.3) | 47 (25.4) | 0.31 | 117 (81.3) | 109 (83.9) | 0.84 |
| Past | 7 (16.3) | 36 (19.5) | 7 (4.9) | 6 (4.6) | |||
| Current | 29 (67.4) | 102 (55.1) | 20 (13.9) | 15 (11.5) | |||
| Height | Q1 | 20 (46.5) | 45 (24.9) | 0.01 | 52 (36.1) | 23 (17.7) | < 0.001 |
| Q2 | 10 (23.3) | 43 (23.8) | 39 (27.1) | 30 (23.1) | |||
| Q3 | 10 (23.3) | 47 (26.0) | 33 (22.9) | 39 (30.0) | |||
| Q4 | 3 (7.0) | 46 (25.4) | 20 (13.9) | 38 (29.2) | |||
| Height (cm)* | 159.4±6.7 | 162.9±6.5 | 0.002 | 146.8±5.8 | 149.4±5.3 | < 0.001 | |
| Sex | Variable | Low/normal | cOR | aOR* | aOR† |
|---|---|---|---|---|---|
| Men | Height (cm) | ||||
| Q4: ≥ 167.1 | 3/46 | 1.0 | 1.0 | 1.0 | |
| Q3: 162.1-167.0 | 10/47 | 3.26 (0.84-12.62) | 3.29 (0.84-12.82) | 2.72 (0.62-11.96) | |
| Q2: 158.1-162.0 | 10/43 | 3.57 (0.92-13.83) | 3.49 (0.89-13.63) | 2.10 (0.70-13.67) | |
| Q1: ≤158.0 | 20/45 | 6.82 (1.89-24.54) | 6.39 (1.75-23.41) | 4.20 (1.02-17.36) | |
| Women | Height (cm) | ||||
| Q4: ≥ 152.1 | 20/38 | 1.0 | 1.0 | 1.0 | |
| Q3: 148.1-152.0 | 33/39 | 1.61 (0.79-3.28) | 1.37 (0.66-2.89) | 1.36 (0.53-3.50) | |
| Q2: 144.1-148.0 | 39/30 | 2.47 (1.20-5.08) | 2.25 (1.08-4.72) | 1.24 (0.48-3.23) | |
| Q1: ≤144.0 | 52/23 | 4.29 (2.07-8.92) | 3.34 (1.55-7.20) | 1.65 (0.62-4.40) |
Values are presented asnumber (%) or mean±SD.
*Wilcoxon's rank sum test.
Values are presented as number or odds ratio (confidence interval). Odds ratio (95% confidence interval). cOR, crude odds ratio; aOR, adjusted odds ratio.
*Adjusted for age; †Adjusted for age, education, and smoking (only for men).

 KSE
KSE


 PubReader
 ePub Link
 Cite
Cite

