
Articles
- Page Path
- HOME > Epidemiol Health > Volume 43; 2021 > Article
-
Original Article
Joint association of aerobic physical activity and muscle-strengthening activities with metabolic syndrome : the Korean National Health and Nutrition Examination Survey 2014-2015 -
Jungjun Lim
 , Soyoung Park, Joon-Sik Kim*
 -
Epidemiol Health 2021;43:e2021096.
DOI: https://doi.org/10.4178/epih.e2021096
Published online: November 6, 2021
Department of Physical Education, College of Education, Seoul National University, Seoul, Korea
- Correspondence: Joon-Sik Kim Department of Physical Education, College of Education, Seoul National University, 1 Gwanak-ro, Gwanak-gu, Seoul 08826, Korea E-mail: joonsik@snu.ac.kr
- *Current affiliation: Department of Adapted Physical Education, Baekseok University, Cheonan, Korea.
©2021, Korean Society of Epidemiology
This is an open-access article distributed under the terms of the Creative Commons Attribution License (http://creativecommons.org/licenses/by/4.0/), which permits unrestricted use, distribution, and reproduction in any medium, provided the original work is properly cited.
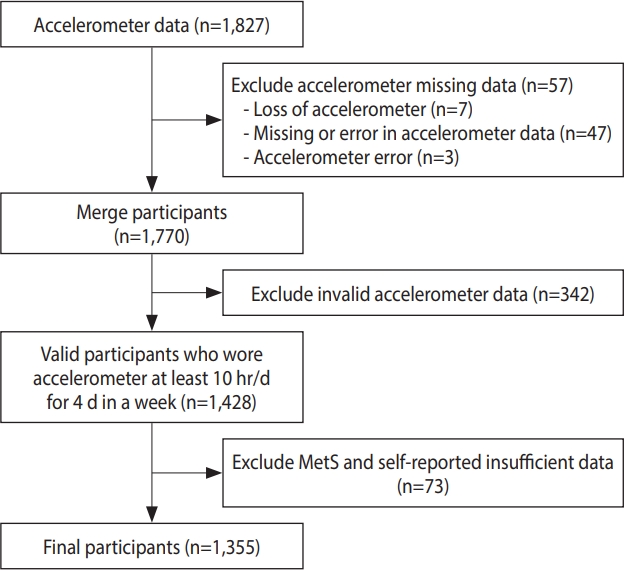
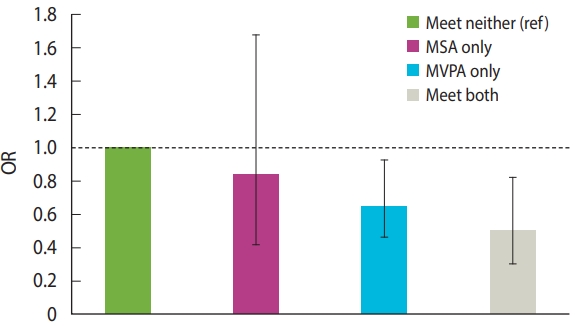
Figure & Data
References
Citations
- Association Between Frequency of Muscle-Strengthening Exercise and Depression Symptoms Among Middle and High School Students: Cross-Sectional Survey Study
Hao Wang, Huaidong Du, Yunqi Guan, Jieming Zhong, Na Li, Jin Pan, Min Yu
JMIR Public Health and Surveillance.2024; 10: e50996. CrossRef - The effect of Tabata-style functional high-intensity interval training on cardiometabolic health and physical activity in female university students
Yining Lu, Huw D. Wiltshire, Julien Steven Baker, Qiaojun Wang, Shanshan Ying
Frontiers in Physiology.2023;[Epub] CrossRef - Association of Aerobic and Muscle-strengthening Activities with AIP in Korean Adults: Korea National Health and Nutrition Examination Survey 2014-2019
Jungjun Lim, Yang Hei, Yeonsoo Kim
Journal of Korean Association of Physical Education and Sport for Girls and Women.2022; 36(3): 245. CrossRef - Current status of health promotion in Korea
Soo Young Kim
Journal of the Korean Medical Association.2022; 65(12): 776. CrossRef - Aerobic or Muscle-Strengthening Physical Activity: Which Is Better for Health?
Angelique G. Brellenthin, Jason A. Bennie, Duck-chul Lee
Current Sports Medicine Reports.2022; 21(8): 272. CrossRef
 PubReader
 ePub Link
 Cite
Cite- Figure
-
- Related articles
-
- Individual- and neighborhood-level factors influencing diet quality: a multilevel analysis using Korea National Health and Nutrition Examination Survey data, 2010-2019
- Association of dietary inflammatory index with mortality risk: a prospective analysis of the Korea National Health and Nutrition Examination Survey
- Prevalence of cardiovascular-kidney-metabolic syndrome in Korea: Korea National Health and Nutrition Examination Survey 2011-2021
- Importance of younger age group and high inflammatory status in the association between periodontal disease and diabetes mellitus: results from the Korea National Health and Nutrition Examination Survey 2012-2018
- Development and validation of the Health Literacy Index for the Community for the Korean National Health and Nutrition and Examination Survey


Figure 1.
Figure 2.
| Characteristics | Mean (SE) or n (%) | 95% CI |
|
|---|---|---|---|
| Lower limit | Upper limit | ||
| Age (yr) | 44.7 (0.3) | 44.1 | 45.4 |
| Sex (female) | 862 (63.6) | 61.0 | 66.1 |
| Educational level | |||
| <Elementary school | 112 (8.2) | 6.7 | 9.7 |
| <Middle school | 135 (9.9) | 8.3 | 11.5 |
| <High school | 545 (40.2) | 37.6 | 42.8 |
| >Undergraduate | 563 (41.5) | 38.9 | 44.1 |
| Family income (percentile) | |||
| <25 | 91 (6.7) | 5.3 | 8.0 |
| 25-50 | 343 (25.3) | 22.9 | 27.6 |
| 50-75 | 457 (33.7) | 31.2 | 36.2 |
| 75-100 | 464 (34.2) | 31.7 | 36.7 |
| Smoking |
|||
| No | 1,175 (86.7) | 84.9 | 88.5 |
| Yes | 180 (13.2) | 11.4 | 15.0 |
| Alcohol |
|||
| No | 612 (45.1) | 42.5 | 47.8 |
| Yes | 743 (54.8) | 52.1 | 57.4 |
| BMI (kg/m2) | |||
| Underweight (<18.5) | 56 (4.1) | 3.0 | 5.1 |
| Normal (18.5-24.9) | 872 (64.3) | 61.8 | 66.9 |
| Obese (≥25.0) | 427 (31.5) | 29.0 | 33.9 |
| Physical activity guideline adherence | |||
| Meet neither | 510 (37.6) | 35.0 | 40.2 |
| MVPA only |
563 (41.5) | 38.9 | 44.1 |
| MSA only |
82 (6.0) | 4.7 | 7.3 |
| Meet both | 200 (14.7) | 12.8 | 16.6 |
| Metabolic syndrome | 307 (22.6) | 20.4 | 24.8 |
| High waist circumference | 287 (21.1) | 19.0 | 23.3 |
| High triglyceride | 408 (30.1) | 27.6 | 32.5 |
| Low HDL-cholesterol | 498 (36.7) | 34.1 | 39.3 |
| High blood pressure | 379 (27.9) | 25.5 | 30.3 |
| High fasting glucose | 371 (27.3) | 25.0 | 29.7 |
| Variables | People with MetS | People without MetS | p-value |
|---|---|---|---|
| Meet neither | 128 (41.6) | 382 (36.4) | 0.095 |
| MSA only | 19 (6.1) | 63 (6.0) | 0.909 |
| MVPA only | 124 (40.3) | 439 (41.8) | 0.639 |
| Meet both | 36 (11.7) | 164 (15.6) | 0.088 |
| MetS risk factors | OR (95% CI) | p-value |
|---|---|---|
| High waist circumference | ||
| Met neither | 1.00 (reference) | |
| MSA only | 0.34 (0.13, 0.91) | 0.032 |
| MVPA only | 0.92 (0.58, 1.45) | 0.724 |
| Met both | 0.87 (0.46, 1.64) | 0.673 |
| High triglycerides | ||
| Met neither | 1.00 (reference) | |
| MSA only | 0.86 (0.49, 1.51) | 0.613 |
| MVPA only | 0.82 (0.61, 1.09) | 0.179 |
| Met both | 0.59 (0.93, 0.88) | 0.011 |
| Low HDL-cholesterol | ||
| Met neither | 1.00 (reference) | |
| MSA only | 0.90 (0.54, 1.50) | 0.691 |
| MVPA only | 0.84 (0.64, 1.09) | 0.191 |
| Met both | 0.46 (0.31, 0.68) | <0.001 |
| High blood pressure | ||
| Met neither | 1.00 (reference) | |
| MSA only | 1.41 (0.79, 2.25) | 0.243 |
| MVPA only | 1.27 (0.94, 1.71) | 0.117 |
| Met both | 1.03 (0.68, 1.57) | 0.859 |
| High fasting glucose | ||
| Met neither | 1.00 (reference) | |
| MSA only | 1.07 (0.59, 1.93) | 0.819 |
| MVPA only | 1.03 (0.76, 1.39) | 0.816 |
| Met both | 0.92 (0.61, 1.40) | 0.712 |
SE, standard error; CI, confidence interval; BMI, body mass index, MVPA, moderate to vigorous physical activity, MSA, muscle-strengthening activity, HDL, high-density lipoprotein. Smoking: No means ‘have never smoked cigarettes before’ or ‘past smoker,’ Yes means ‘current smoker.’ Alcohol: No means ‘have never consumed alcohol before’ or ‘less than1 glass of alcohol was consumed in a month in a recent year,’ Yes means ‘more than 1 glass of alcohol was consumed in a month in a recent year.’ MVPA only: A group that met the MVPA guideline but not the MSA guideline. MSA only: A group that met the MSA guideline but not the MVPA guideline.
Data are presented as number (%). MetS, metabolic syndrome, MSA, muscle-strengthening activity, MVPA, moderate to vigorous physical activity. Chi-square test.
MetS, metabolic syndrome; CI, confidence interval; MSA: muscle-strengthening activity; MVPA: moderate to vigorous physical activity; HDL, high-density lipoprotein. Adjusted for the following covariates: sex, age, family income, education, alcohol consumption, smoking, body mass index, and accelerometer wearing time.

