
Articles
- Page Path
- HOME > Epidemiol Health > Volume 42; 2020 > Article
-
Original Article
Recovery time from severe acute malnutrition and associated factors among under-5 children in Yekatit 12 Hospital, Addis Ababa, Ethiopia: a retrospective cohort study -
Mekonen Adimasu1
 , Girum Sebsibie1, Fikrtemariam Abebe1, Getaneh Baye2, Kerebih Abere1
 -
Epidemiol Health 2020;42:e2020003.
DOI: https://doi.org/10.4178/epih.e2020003
Published online: February 2, 2020
1School of Nursing, Addis Ababa University College of Health Sciences, Addis Ababa, Ethiopia
2Debre Berhan University College of Medicine, Debre-Berhan, Ethiopia
- Correspondence: Mekonen Adimasu School of Nursing, Addis Ababa University College of Health Sciences, P.O. Box 4412, Addis Ababa, Ethiopia E-mail: mekonen.adimasu@aau.edu.et
©2020, Korean Society of Epidemiology
This is an open-access article distributed under the terms of the Creative Commons Attribution License (http://creativecommons.org/licenses/by/4.0/), which permits unrestricted use, distribution, and reproduction in any medium, provided the original work is properly cited.
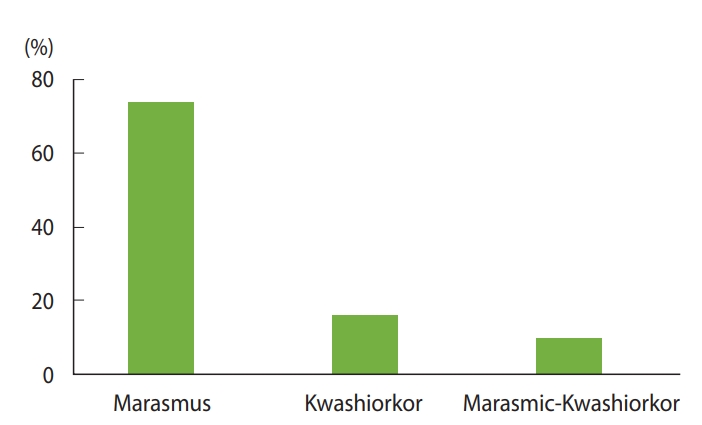
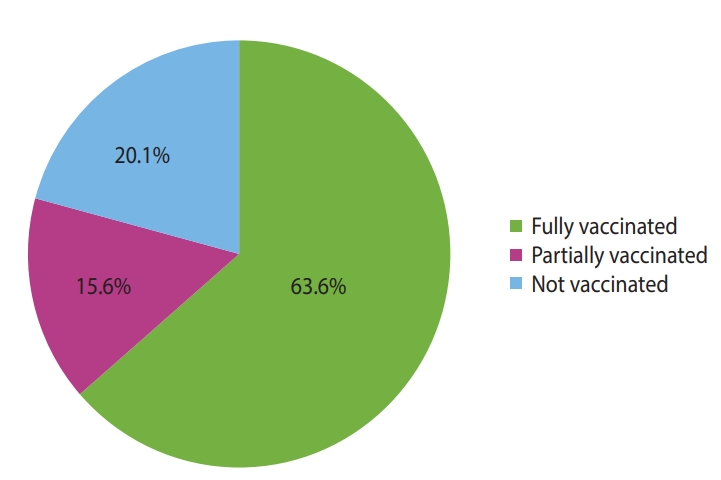
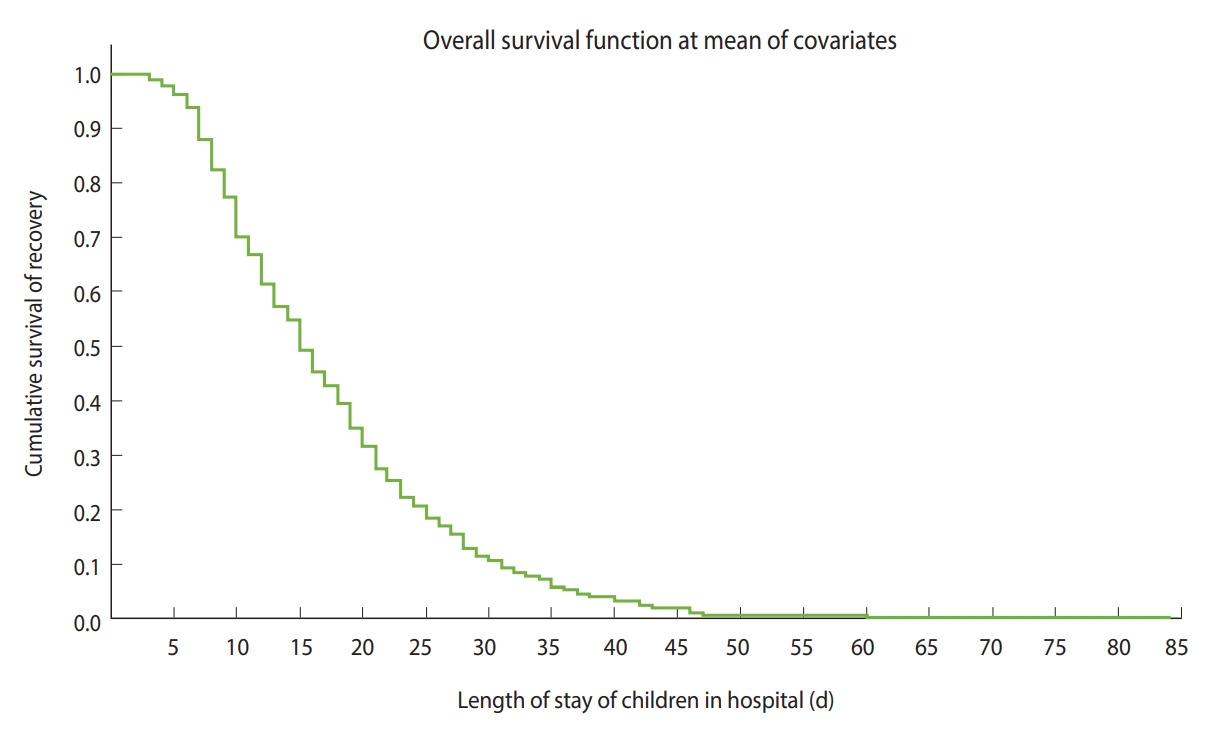
Figure & Data
References
Citations
- Time to Recovery From Severe Acute Malnutrition to Normal Nutritional Status and Its Predictors Among Children Aged 6–59 Months in North‐East Ethiopia
Temesgen Gebeyehu Wondmeneh, Amarech Giruma
Maternal & Child Nutrition.2025;[Epub] CrossRef - Time to recovery from severe acute malnutrition and predictors among children aged 6–59 months at public hospitals: retrospective follow-up study
Hailemariam Mekonnen Workie, Belay Hundera Sima, Aschalaw Afework Bitew, Dagnew Tigabu
Scientific Reports.2025;[Epub] CrossRef - Recovery rate and predictors of severe acute malnutrition among under-five children admitted to therapeutic feeding units in Ethiopia: a systematic review and meta-analysis
Amanuel Adugna, Gossa Fetene Abebe, Melsew Setegn Alie, Desalegn Girma
BMJ Nutrition, Prevention & Health.2025; 8(1): 327. CrossRef - Recovery rate and predictors of treatment outcomes among hospitalized under five children with severe acute malnutrition: a prospective cohort study
Dagnachew Mekete, Alemayehu Toma, Tamrat Balcha
Exploration of Medicine.2025;[Epub] CrossRef - Treatment outcomes and associated factors of severe acute malnutrition among under-5 children in Jigjiga public hospitals, Somali region, Ethiopia: a retrospective cohort study
Mustafe Mahamud Abdi, Iid Muktar Jama, Abdilahi Ibrahim Muse, Girma Tadesse Wedajo, Mohamed Omar Osman, Kalkidan Hassen Abate
BMJ Public Health.2025; 3(2): e001737. CrossRef - Stabilizing time and its predictors among 1–59 months old children managed for severe acute malnutrition during the humanitarian crisis in Tigray regional state of Ethiopia, 2023: a prospective cohort study
Wagnew Tesfay, Mebrahtu Abay, Berhane Fseha Teklehaimanot, Ataklti Gebremedhin
BMC Pediatrics.2024;[Epub] CrossRef - Predictors of recovery from severe acute malnutrition among 6–59 months children admitted to a hospital
Assefa Andargie, Segenet Zewdie
Frontiers in Public Health.2024;[Epub] CrossRef - Determinants of recovery time from severe acute malnutrition among cholera-exposed and unexposed children in Ethiopia: a prospective cohort study
Alemayehu Belay Alamneh, Kalkidan Hassen Abate, Ashagre Molla Assaye, Yeshambel Worku Demlie, Moti Edosa Guma, Tefera Belachew
Frontiers in Nutrition.2024;[Epub] CrossRef - Recovery time and its predictors of severe acute malnutrition among under five children admitted at the therapeutic feeding center of Hiwot Fana comprehensive specialized hospital, eastern Ethiopia, 2024: a semi-parametric model
Fentahun Meseret, Mulualem Keneni, Ayichew Alemu, Diribsa Tizazu, Tesfaye Asfaw Alemayehu, Yalew Mossie, Tilahun Teshager, Fenta Wondimneh
Frontiers in Nutrition.2024;[Epub] CrossRef - Burden of Wasting and Stunting in Colombia and Its Economic Impact: A Society’s Perspective Analysis, 2021
Darío Londoño Trujillo, Paula Andrea Taborda Restrepo, María Camila De la Hoz, Juan Carlos Burgos Castro, Joan Sebastian Arbelaez Vargas, Diana María Pineda Ruiz
Nutrients.2024; 16(24): 4302. CrossRef - Time to recovery from severe acute malnutrition and its predictors among under five children admitted to therapeutic feeding units of general and referral hospitals in Tigray, Ethiopia, 2020: a prospective cohort study
Gebretsadkan Fisseha Kidane, Kidane Zereabruk, Woldu Aberhe, Abrha Hailay, Guesh Mebrahtom, Gebreamlak Gebremedhn Gebremeskel, Teklehaimanot Gereziher Haile, Desalegn Massa Teklemichael
BMC Pediatrics.2023;[Epub] CrossRef - Impact of malnutrition on the outcome and length of hospital stay in elective pediatric surgical patients: prospective cohort study at tertiary hospitals in Ethiopia
Belachew D. Wondemagegnehu, Woubedel K. Aklilu, Milliard D. Beyene, Bareng A. Sanny Nonyane
BMC Nutrition.2023;[Epub] CrossRef - Comorbidities of Child Malnutrition in Low‐ and Medium‐Income Countries
Tshepiso Moate, Tinda Rabie, Catharina Minnie, Anne Mäenpää
Journal of Pediatric Gastroenterology and Nutrition.2022; 75(4): 400. CrossRef - Severe acute malnutrition’s recovery rate still below the minimum standard: predictors of time to recovery among 6- to 59-month-old children in the healthcare setting of Southwest Ethiopia
Seyum Ebissa Eyi, Gebiso Roba Debele, Efrem Negash, Kebebe Bidira, Debela Tarecha, Kabtamu Nigussie, Mohammedamin Hajure, Mohammedjud Hassen Ahmed, Bilisumamulifna Tefera Kefeni
Journal of Health, Population and Nutrition.2022;[Epub] CrossRef - Preparation and quality characterization of marine small pelagic fish powder: A novel ready-to-use nutritious food product for vulnerable populations
Abdullah-Al Mamun, Shuva Bhowmik, Md. Shahid Sarwar, Sharmin Akter, Tanjina Pias, MUM Abu Zakaria, Md. Monirul Islam, Hillary Egna, Ford Evans, Md Abdul Wahab, Shakuntala Haraksingh Thilsted, David C. Little
Measurement: Food.2022; 8: 100067. CrossRef - Assessment, outcomes and implications of multiple anthropometric deficits in children
Idzes Kundan, Rajalakshmi Nair, Shashwat Kulkarni, Aparna Deshpande, Raju Jotkar, Mrudula Phadke
BMJ Nutrition, Prevention & Health.2021; 4(1): 267. CrossRef - Risk factors for severe acute malnutrition among children aged 6–59 months: A community-based case-control study from Vellore, Southern India
SamM David, RubyA Pricilla, SherinS Paul, Kuryan George, Anuradha Bose, JasminH Prasad
Journal of Family Medicine and Primary Care.2020; 9(5): 2237. CrossRef - Time to Recovery and Its Predictors among Children 6–59 Months Admitted with Severe Acute Malnutrition to East Amhara Hospitals, Northeast Ethiopia: A Multicenter Prospective Cohort Study
Telahun Kasa Tefera, Solomon Mekonnen Abebe, Melkamu Tamir Hunegnaw, Freezer Girma Mekasha
Journal of Nutrition and Metabolism.2020; 2020: 1. CrossRef
 PubReader
 ePub Link
 Cite
Cite


Figure 1.
Figure 2.
Figure 3.
| Variables | Frequency (%) |
|---|---|
| HIV/AIDS | |
| Yes | 39 (9.2) |
| No | 384 (90.8) |
| Anemia | |
| Yes | 181 (42.8) |
| No | 242 (57.2) |
| Dehydration | |
| Yes | 83 (19.6) |
| No | 340 (80.4) |
| Fever | |
| Yes | 140 (33.1) |
| No | 283 (66.9) |
| Axillary temperature (°C) | |
| <38 | 62 (14.7) |
| ≥38 | 79 (18.7) |
| Congenital heart disease | |
| Yes | 40 (9.5) |
| No | 383 (90.5) |
| Diarrheal disease(s) | |
| Yes | 224 (53.0) |
| No | 199 (47.0) |
| Tuberculosis | |
| Yes | 24 (5.7) |
| No | 399 (94.3) |
| Pneumonia | |
| Yes | 179 (42.3) |
| No | 244 (57.7) |
| Gastroenteritis | |
| Yes | 202 (47.8) |
| No | 221 (52.2) |
| Sepsis | |
| Yes | 85 (20.1) |
| No | 338 (79.9) |
| Rickets | |
| Yes | 70 (16.5) |
| No | 353 (83.5) |
| Stunting | |
| Yes | 106 (25.1) |
| No | 317 (74.9) |
| Global developmental delay | |
| Yes | 42 (9.9) |
| No | 381 (90.1) |
| Shock | |
| Yes | 37 (8.7) |
| No | 386 (91.3) |
| Microcephaly | |
| Yes | 31 (7.3) |
| No | 392 (92.7) |
| Variables | Frequency (%) |
|---|---|
| Routine treatments administered | |
| IV antibiotic(s) | |
| Yes | 378 (89.4) |
| No | 45 (10.6) |
| Oral antibiotic(s) | |
| Yes | 205 (48.5) |
| No | 218 (51.5) |
| Albendazole/mebendazole | |
| Yes | 22 (5.2) |
| No | 63 (14.9) |
| Not applicable | 338 (79.9) |
| Special medication | |
| IV fluids | |
| Yes | 67 (15.8) |
| No | 356 (84.2) |
| ReSoMal | |
| Yes | 180 (42.6) |
| No | 243 (57.4) |
| Supplements administered | |
| Vitamin A | |
| Yes | 69 (16.3) |
| No | 354 (83.7) |
| Iron | |
| Yes | 92 (21.7) |
| No | 331 (78.3) |
| Folic acid | |
| Yes | 160 (37.8) |
| No | 263 (62.2) |
| Zinc | |
| Yes | 61 (14.4) |
| No | 362 (85.6) |
| Therapeutic foods administered | |
| Formula milk-75 | |
| Yes | 310 (73.3) |
| No | 113 (26.7) |
| Formula milk-100 | |
| Yes | 390 (92.2) |
| No | 33 (7.8) |
| RUTF | |
| Yes | 145 (34.3) |
| No | 278 (65.7) |
| Characteristics | Category | Median recovery time (d) |
||||
|---|---|---|---|---|---|---|
| Estimate | 95% CI |
Log-rank |
p-value |
|||
| UL | LL | χ2 value | ||||
| Age (mo) | <24 | 15.00 | 13.73 | 16.27 | 6.739 | 0.009 |
| ≥24 | 19.00 | 16.19 | 21.81 | |||
| Residence | Urban | 14.00 | 12.66 | 15.34 | 17.401 | <0.001 |
| Rural | 20.00 | 17.70 | 22.30 | |||
| Type of malnutrition | Marasmus | 14.00 | 12.68 | 15.32 | 14.769 | 0.001 |
| Kwashiorkor | 21.00 | 18.45 | 23.55 | |||
| Marasmic kwashiorkor | 21.00 | 17.84 | 24.16 | |||
| Vaccination status | Fully vaccinated | 13.00 | 11.68 | 14.32 | 34.031 | <0.001 |
| Partially vaccinated | 19.00 | 17.09 | 20.90 | |||
| Not vaccinated | 23.00 | 19.41 | 26.58 | |||
| HIV/AIDS | Yes | 21.00 | 18.51 | 23.49 | 6.194 | 0.013 |
| No | 15.00 | 13.76 | 16.23 | |||
| Anemia | Yes | 17.00 | 14.79 | 19.21 | 5.860 | 0.015 |
| No | 14.00 | 12.27 | 15.73 | |||
| Tuberculosis | Yes | 21.00 | 14.09 | 27.91 | 5.678 | 0.017 |
| No | 15.00 | 13.76 | 16.24 | |||
| Pneumonia | Yes | 19.00 | 17.11 | 20.90 | 18.202 | <0.001 |
| No | 13.00 | 11.62 | 14.38 | |||
| Stunting | Yes | 20.00 | 17.53 | 22.47 | 17.775 | <0.001 |
| No | 14.00 | 12.87 | 15.13 | |||
| Shock | Yes | 26.00 | 20.55 | 31.45 | 13.094 | <0.001 |
| No | 15.00 | 13.76 | 16.24 | |||
| Deworming | Yes | 9.00 | 7.16 | 10.84 | 23.228 | <0.001 |
| No | 23.00 | 19.95 | 26.04 | |||
| IV fluid | Yes | 25.00 | 19.82 | 30.18 | 15.351 | <0.001 |
| No | 15.00 | 13.73 | 16.27 | |||
| ReSoMal | Yes | 14.00 | 12.71 | 15.29 | 5.281 | 0.022 |
| No | 17.00 | 15.17 | 18.83 | |||
| Daily weight gain (g/kg/d) | <8 | 20.00 | 18.83 | 21.17 | 79.509 | <0.001 |
| ≥8 | 11.00 | 10.01 | 11.99 | |||
| Overall | 15.00 | 13.61 | 16.39 | |||
| Covariates | Category | cHR (95% CI) | aHR (95% CI) | p-value |
|---|---|---|---|---|
| Age | 0.98 (0.98, 0.99) | 0.98 (0.97, 1.00) | 0.001 | |
| Sex | Male | 1.23 (0.99, 1.53) | 0.84 (0.67, 1.06) | 0.062 |
| Female | 1.00 (reference) | 1.00 (reference) | ||
| Residence | Urban | 1.60 (1.27, 2.03) | 1.20 (0.93, 1.56) | <0.001 |
| Rural | 1.00 (reference) | 1.00 (reference) | ||
| Type of malnutrition | Marasmus | 1.00 (reference) | 1.00 (reference) | |
| Kwashiorkor | 0.63 (0.45, 0.85) | 0.86 (0.41, 1.84) | 0.002 | |
| Marasmic kwashiorkor | 0.64 (0.45, 0.91) | 0.78 (0.36, 1.70) | 0.014 | |
| Vaccination status | Fully vaccinated | 2.14 (1.61, 2.86) | 1.64 (1.20, 2.24) | <0.001 |
| Partially vaccinated | 1.40 (0.96, 2.04) | 1.25 (0.84, 1.87) | 0.083 | |
| Not vaccinated | 1.00 (reference) | 1.00 (reference) | ||
| HIV/AIDS | Yes | 0.65 (0.46, 0.93) | 0.86 (0.59, 1.26) | 0.018 |
| No | 1.00 (reference) | 1.00 (reference) | ||
| Anemia | Yes | 0.78 (0.63, 0.96) | 1.08 (0.85, 1.36) | 0.020 |
| No | 1.00 (reference) | 1.00 (reference) | ||
| Dehydration | Yes | 0.83 (0.63, 1.09) | 1.08 (0.76, 1.54) | 0.178 |
| No | 1.00 (reference) | 1.00 (reference) | ||
| Fever | Yes | 1.16 (0.92, 1.45) | 1.07 (0.82, 1.40) | 0.210 |
| No | 1.00 (reference) | 1.00 (reference) | ||
| Diarrhea | Yes | 0.84 (0.68, 1.04) | 0.72 (0.46, 1.13) | 0.110 |
| No | 1.00 (reference) | 1.00 (reference) | ||
| Tuberculosis | Yes | 0.58 (0.37, 0.93) | 0.98 (0.59, 1.65) | 0.024 |
| No | 1.00 (reference) | 1.00 (reference) | ||
| Pneumonia | Yes | 0.64 (0.51, 0.79) | 0.76 (0.60, 0.97) | <0.001 |
| No | 1.00 (reference) | 1.00 (reference) | ||
| Age | Yes | 0.86 (0.70, 1.07) | 1.08 (0.68, 1.71) | 0.174 |
| No | 1.00 (reference) | 1.00 (reference) | ||
| Rickets | Yes | 0.77 (0.59, 1.02) | 0.98 (0.72, 1.32) | 0.071 |
| No | 1.00 (reference) | 1.00 (reference) | ||
| Stunting | Yes | 0.60 (0.47, 0.77) | 0.67 (0.50, 0.88) | <0.001 |
| No | 1.00 (reference) | 1.00 (reference) | ||
| Shock | Yes | 0.48 (0.31, 0.73) | 0.53 (0.32, 0.87) | 0.001 |
| No | 1.00 (reference) | 1.00 (reference) | ||
| Microcephaly | Yes | 0.76 (0.49, 1.15) | 0.84 (0.54, 1.31) | 0.196 |
| No | 1.00 (reference) | 1.00 (reference) | ||
| IV antibiotics | Yes | 0.76 (0.53, 1.08) | 0.96 (0.65, 1.41) | 0.130 |
| No | 1.00 (reference) | 1.00 (reference) | ||
| Deworming | Yes | 1.00 (reference) | 1.00 (reference) | <0.001 |
| No | 0.33 (0.20, 0.55) | 0.26 (0.11, 0.61) | ||
| IV fluid | Yes | 0.55 (0.40, 0.75) | 0.79 (0.52, 1.21) | <0.001 |
| No | 1.00 (reference) | 1.00 (reference) | ||
| ReSoMal | Yes | 1.27 (1.03, 1.57) | 1.20 (0.90, 1.59) | 0.027 |
| No | 1.00 (reference) | 1.00 (reference) | ||
| Vitamin A | Yes | 1.22 (0.91, 1.64) | 1.35 (0.97, 1.86) | 0.173 |
| No | 1.00 (reference) | 1.00 (reference) | ||
| Daily weight gain (g/kg/d) | <8 | 1.00 (reference) | 1.00 (reference) | <0.001 |
| ≥8 | 2.27 (1.76, 2.93) | 2.16 (1.64, 2.84) |
IV, intravenous; ReSoMal, rehydration solution for malnutrition; RUTF, ready-to-use therapeutic food.
CI, confidence interval; UL, upper limit; LL, lower limit; IV, intravenous; ReSoMal, rehydration solution for malnutrition. A p-value of ≤0.05 indicates the presence of a significant difference between groups of predictor variables.
Bivariate Cox regression analysis was done for each predictor variable. Then, variables that had p≤0.25 in the binary Cox regression analysis were entered into the multivariate Cox regression analysis. All variables had p≤0.25 in the binary Cox regression analysis. cHR, crude hazard ratio; CI, confidence interval; aHR, adjusted hazard ratio; AGE, acute gastroenteritis; IV, intravenous; ReSoMal, rehydration solution for malnutrition.

